


版权说明:本文档由用户提供并上传,收益归属内容提供方,若内容存在侵权,请进行举报或认领
文档简介
1、第三章 系统的描述与模型建立Chapter 3. Description of Systems and Modeling3.1 系统的描述3.1 Description of Systems- 在对系统进行分析时, 要对所研究的系统进行描述. 即为从开始确定问题时所写的问题剖析报告到具体的数学模型公式或计算机程序. 目的是使我们确立对系统的认识, 便于和其他人进行交流和解释.- When analyzing a system, it is needed to describe the system of interest, that is, from writing the problem i
2、dentification and analysis to furnishing the concrete mathematic model or computer programs. The purpose of doing so is to better learn the system, and better communicate with other staff members in the project.- 自然语言能够形象生动地说明问题, 特别是一词多意, 一意多词, 丰富多彩, 富于表现力. 但随着对事物认识从表面到本质, 由定性到定量, 要求对描述事物的语言有更高的精度,
3、自然语言很难胜任. 同一句话可能有不同的理解, 造成表达上的混乱. - The natural language can be used to more vividly describe the problem, especially one word may contain/convey more-than-one implications, and is full of thrust. However, along with the deeper and better understanding the phenomena, from naturally to quantitatively
4、, one is required to add more accuracy to the subject, and natural language is not able to have such competency to do the job. This is because one word/sentence may be understood differently, and thus give rise to confusion.- 科学术语用精练浓缩的形式集中表现大量知识, 比自然语言有更大的精确 单义性. 术语和它表达的思维内容有唯一确定的对应关系. 但是精确性和明确性仍然受
5、到限制. - 符号语言, 或代码语言用来代替科学术语, 使科学语言更加简明和抽象, 但是信息承载量大大增加. 通用性好, 一经约定, 不同国家和民族的人都可以使用.- Science terminologies use very concise and condensed meaning to convey a large multitude of knowledge collectively, with much better improved accuracy, and with more concentrated definition. Terminologies has an one-
6、to-one match to the thinking in terms of contents, but the accuracy/precision is not satisfactory. To remedy this weakness, symbol language is created to replace the science terminology, on one hand, making it able to be even more concise and abstract, on the other hand, able to contain much more in
7、formation. Anyone with any nationality may understand it once agreed. 3.2 量化和尺度3.2 Quantify and Measure(自学)(self review)3.3 数据的管理3.3 Management of Data(自学)(self review)3.4 指标和指标体系3.4 Targets and Target Systems(自学)(self review)3.5 不确定性描述 (一) 随机性3.5 Description of Uncertainty (1) Randomness 3.5.1 随机性描
8、述3.5.1 Description of Randomness - 不确定性描述分为: - Uncertainty description may be categorized into:1) 随机性描述, 包含 i) 统计分析 ii) 主元分析 iii) 因子分析1) Description of randomness, including i) statistic analysis ii) principle component analysis, iii) factor analysis.2) 模糊性描述.2) Description of fuzziness.- 随机性描述有关概念和
9、定义.- Some concepts and definitions for randomness description.1) 总体: 所调查对象(事物, 现象等)的全体.1) Collection: all the elements under investigation. 2) 个体: 构成总体的元素, 其发生具有偶然性/随机性, 为随机变量.2) component/element: the parts that compose the collection, they occur randomly or accidently. 3) 样本: 总体中抽取的部分个体的集合. 3) Sam
10、ple: a set taken out from the collection.由于总体的元素数量过多, 所以采用抽样观测, 才能呈现出统计的规律性.Due to the large number of elements/components in the collection, use sampled observation to observe the statistic rules对每一次观测, 取p个样本, 得出一次观测 (x1, x2, x3 , xp), 它是一个p维随机向量.用样本的数字特征来推断总体的特征.For each observation, take p sample
11、s, obtain one observation (x1, x2, x3 , xp), it is a random vector of p order. Use the value characteristics of the samples to deduce the characteristic of the collection. 样本的数字特征包括: i) 样本均值 ii) 样本方差 iii) 样本标准偏差The value characteristics of the samples include: i) mean ii) variance iii) standard devi
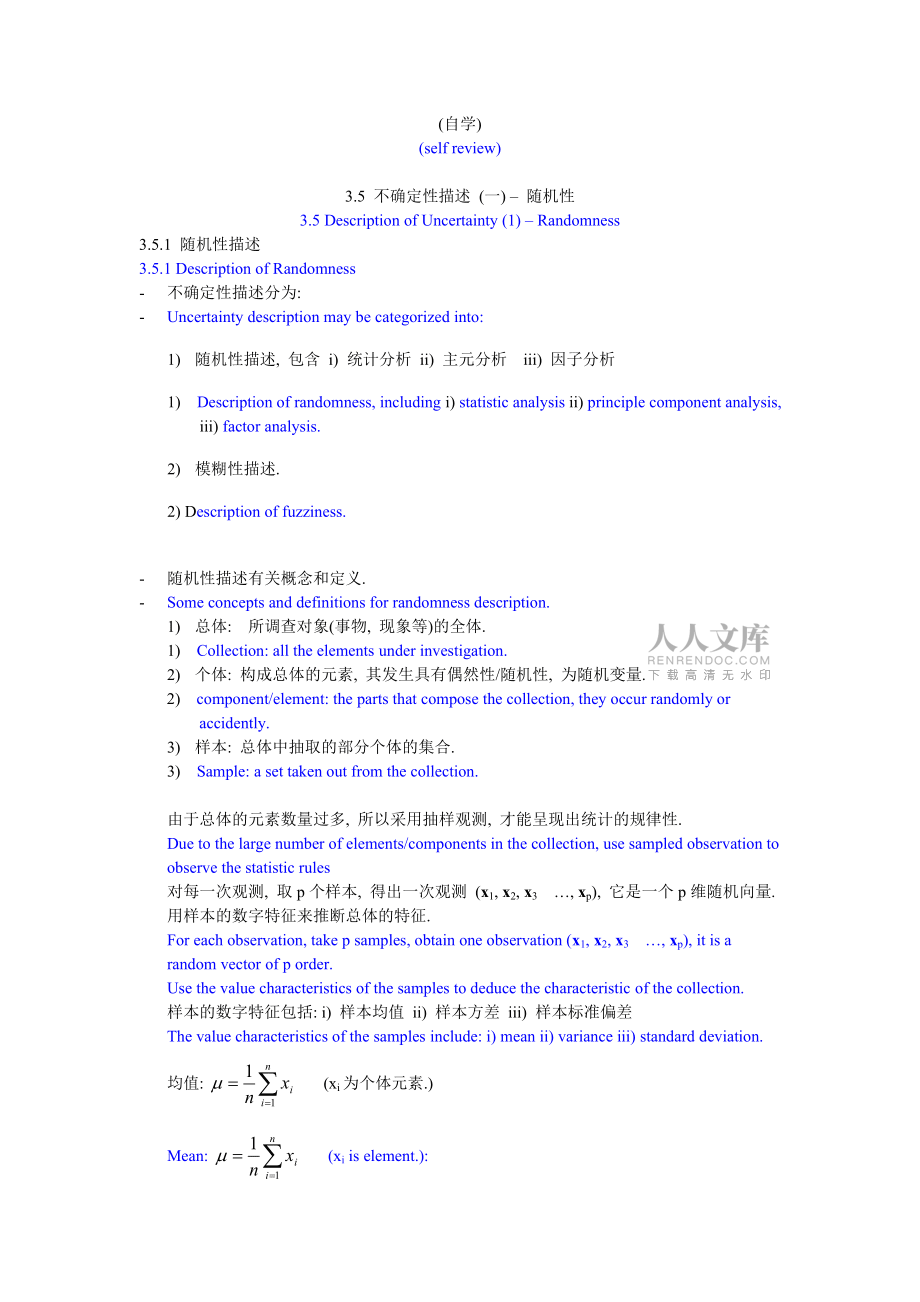
12、ation. 均值: (xi为个体元素.)Mean: (xi is element.): 方差: Variance: 标准偏差: Standard deviation: 样本的数字特征也可用数字的分布表示, 通常是正态(高斯)分布.The value characteristics of samples may be expressed using value distribution, normally use normal distribution or Gaussian distribution. 概率密度函数为: The probability density function (pd
13、f) is: ()其中 为方差, 为平均值.Where is variance, and is mean. 分布函数为:The distribution function is通常记为 Normally denoted as . 注: 当 , 即 时, 称为标准正态分布.Note: when , namely, , it is called standard normal distribution. ()在复杂系统中, 做为结果的应变量通常是多个自变量的函数, 而这些自变量为彼此相关的随机变量. In a complex/intriguing system, as a responsive v
14、ariable, it is usually relates more-than-one variables, and these variables interrelated random ones. 多元变量可用一个p维向量表示:Multiple variables may be expressed using a p-dimension vector.x=x1, x2 xpT注: xi 为若干值, 本身是一个变量, 例如温度等.Note: xi is more than just one value, it itself is a variable, such as temperatur
15、e. X的平均值为The mean of X is 其中 是xi 的均值.Where is the mean of xi .对应于单变量的方差, 多变量采用协方差Corresponding to the single-variable variable, the multiple-variable adopts co-variance .其中E 为数学期望.Where E is the expectation. 多变量的正态分布形式为The normal distribution of the multiple-variable takes the form of其中 是的行列式.Where
16、is the determinant of . 以上是涉及单/多变量样本的数字特征.The description afore involves the value characteristics of single-/mult-variables. 3.5.2 统计分析: 多元线性回归法3.5.2 Statistics analysis: Multiple Linear Regression (MLR)寻求应变量与自变量之间的关系(因果关系), 可用回归分析法.建立模型, Seek the relation between the self-variables and response (c
17、ausal-effect relation), MLR may be applied to build a model. 其中,wherey : 观测或响应. y : Observation or response. bj : 部分回归系数, j=0,1, 2, k bj : Partial regression coefficient, j=0,1, 2, k xj : 回归变量, j=1, 2, kxj : Regressor variable, j=1, 2, ke: 随机误差, 均值为零, 方差为 s2.e: Random error with zero mean and variance s2.Y=Xb+e 其中 WhereY
温馨提示
- 1. 本站所有资源如无特殊说明,都需要本地电脑安装OFFICE2007和PDF阅读器。图纸软件为CAD,CAXA,PROE,UG,SolidWorks等.压缩文件请下载最新的WinRAR软件解压。
- 2. 本站的文档不包含任何第三方提供的附件图纸等,如果需要附件,请联系上传者。文件的所有权益归上传用户所有。
- 3. 本站RAR压缩包中若带图纸,网页内容里面会有图纸预览,若没有图纸预览就没有图纸。
- 4. 未经权益所有人同意不得将文件中的内容挪作商业或盈利用途。
- 5. 人人文库网仅提供信息存储空间,仅对用户上传内容的表现方式做保护处理,对用户上传分享的文档内容本身不做任何修改或编辑,并不能对任何下载内容负责。
- 6. 下载文件中如有侵权或不适当内容,请与我们联系,我们立即纠正。
- 7. 本站不保证下载资源的准确性、安全性和完整性, 同时也不承担用户因使用这些下载资源对自己和他人造成任何形式的伤害或损失。
最新文档
- 2025年教育行业自然灾害课程顾问应急疏散演练配合方案
- 人工智能行业市场前景及投资研究报告:Mobile AI
- 安全管理规章制度的监督检查培训
- 财政捐赠协议书范本
- 货款补偿协议书
- 货车退货协议书
- 2025年电梯运营服务人员培训考核制度
- 颌骨纤维异常增殖症护理查房
- 新建450台光伏设备部件加工机床生产线项目可行性研究报告
- 航空餐食生产线项目可行性研究报告
- 2026年交管12123驾照学法减分完整版练习题库及1套完整答案详解
- 2025中国经皮冠状动脉介入治疗指南课件
- 2026福建福州首邑产业投资集团有限公司招聘19人考试模拟试题及答案解析
- 江苏交通控股有限公司笔试内容
- 国家义务教育质量监测八年级劳动素养综合测试题
- (二模)温州市2026届高三第二次适应性考试地理试卷(含答案)
- 《公路水运工程施工安全标准化指南》
- 社区公共充电设施便民化改造建设方案
- 2026年中考《语文》作文10大主题抢分万能模板
- 社区信息化网络建设推广与应用项目可行性研究报告
- 阿里员工绩效考核制度
评论
0/150
提交评论