豆干片自动上装系统总体设计论文.doc

豆干片自动上装系统总体设计【4张CAD图纸】【优秀】

收藏

压缩包内文档预览:(预览前20页/共69页)
预览图 预览图 预览图 预览图 预览图 预览图 预览图 预览图 预览图 预览图 预览图 预览图 预览图 预览图 预览图 预览图 预览图 预览图 预览图 预览图
编号:291925    类型:共享资源    大小:5.95MB    格式:RAR    上传时间:2014-06-13 上传人:上*** IP属地:江苏
45
积分
关 键 词:
豆干片 自动 上装系统 总体设计 cad图纸
资源描述:

豆干片自动上装系统总体设计

68页 27000字数+说明书+外文翻译+开题报告+4张CAD图纸

中期报告.docx

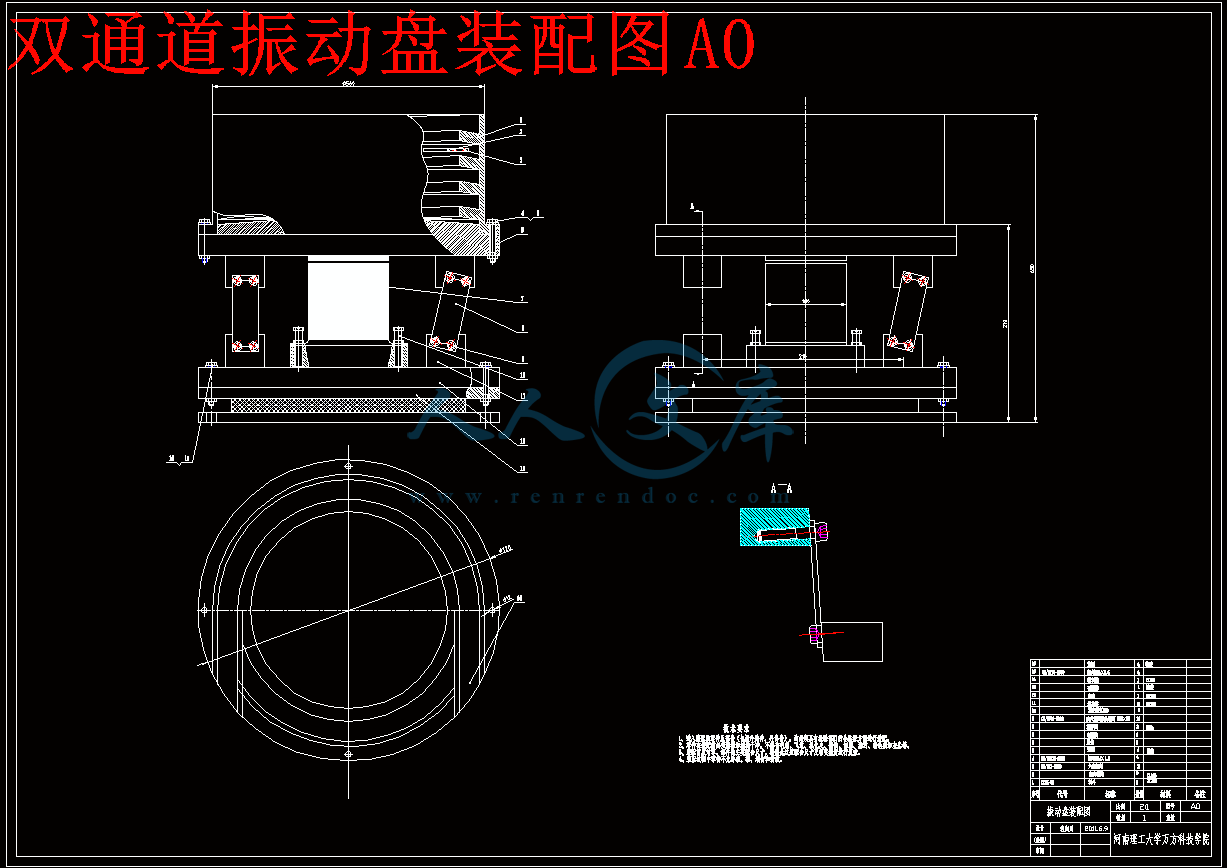
双通道振动盘装配图A0.dwg

外文翻译--电梯传动轴的事故分析  中文版.doc

外文翻译--电梯传动轴的事故分析  英文版.pdf

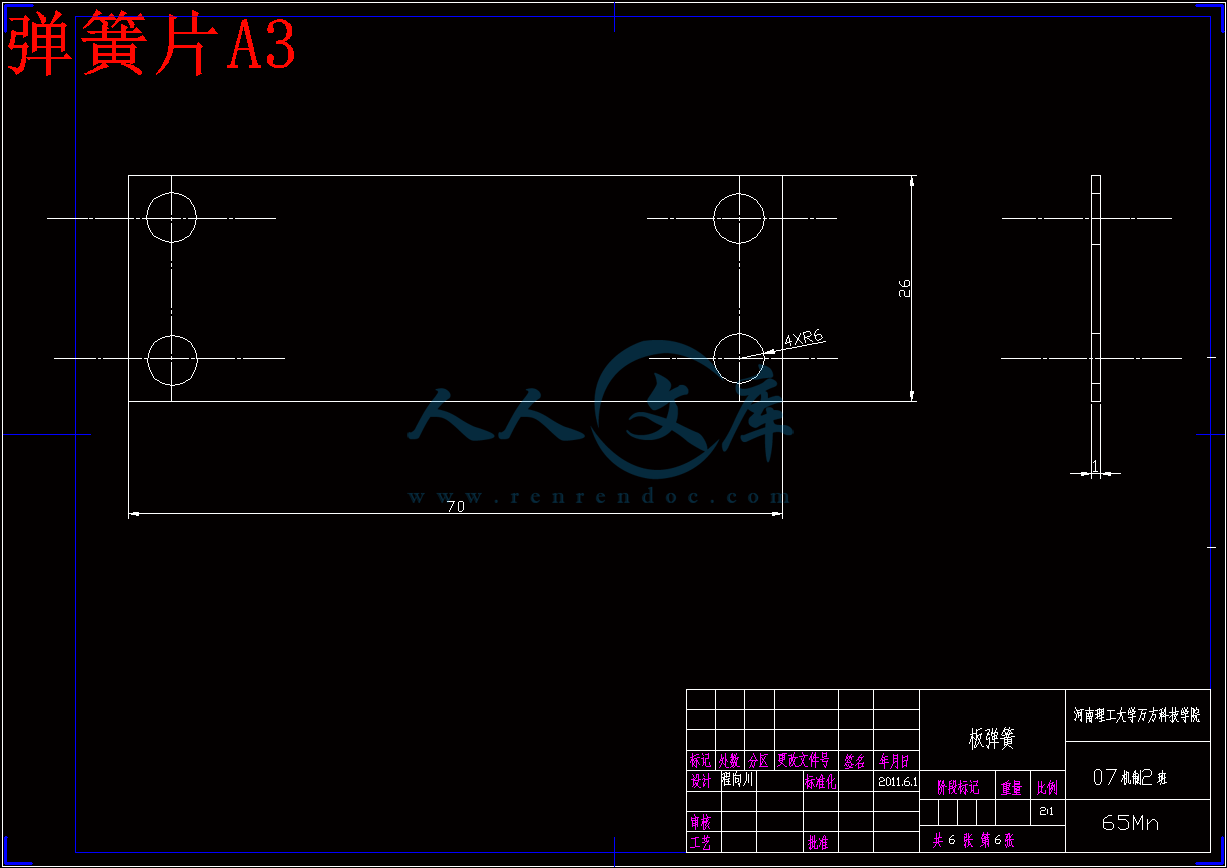
弹簧片A3.dwg

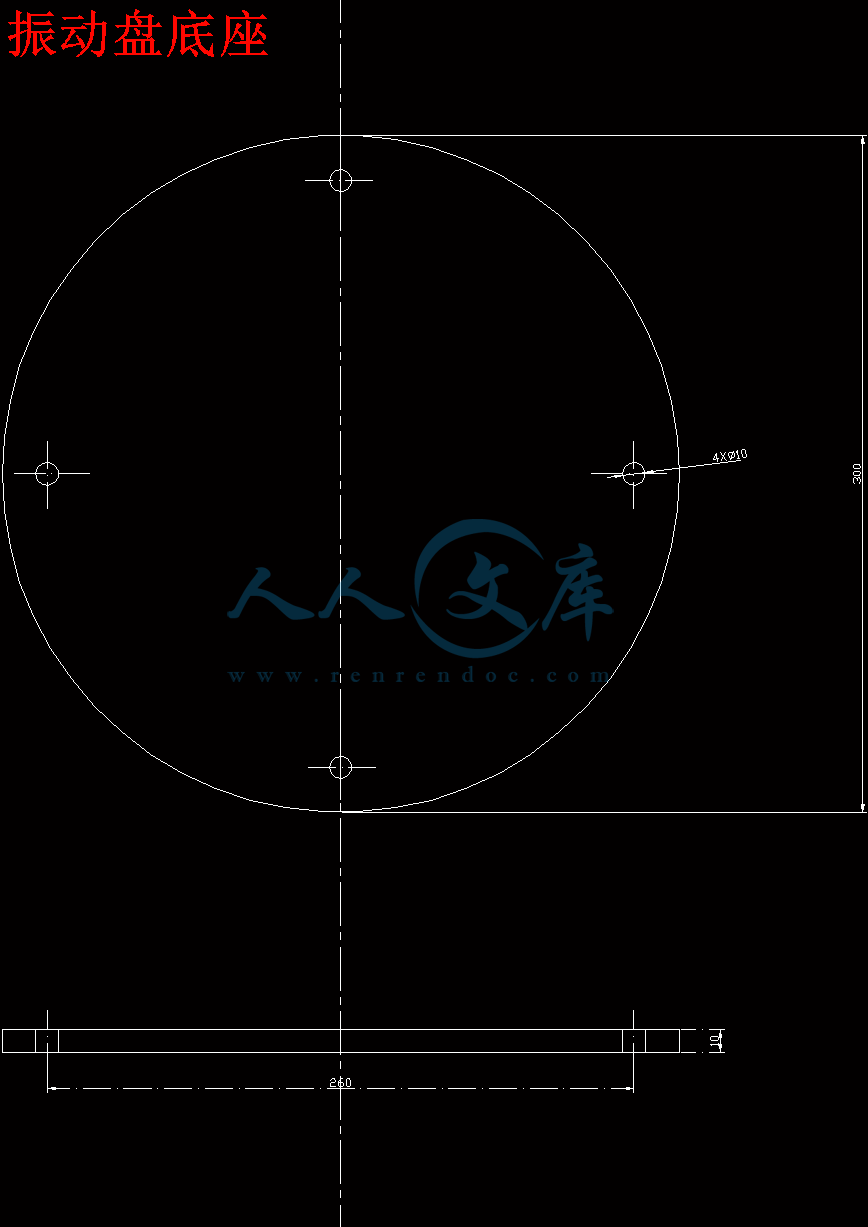
振动盘底座.dwg

料斗A2.dwg

豆干片自动上装系统总体设计开题报告.doc

豆干片自动上装系统总体设计论文.doc

摘  要

   豆干片自动上装排序系统,是个既熟悉又陌生的机械系统,随着豆类食品越来越受到人们的青睐,豆干片的生产工艺的发展完善是不可或缺的部分。在现在国内为市场,还没有豆干片自动上装排序系统机械出现,豆干片的生产厂家要在豆干片的包装过程中花费大量的劳动力,因此,为了改善豆干片的生产工序,提高食品加工的机械化,增加劳动效率,同时保障生产过程中食品的卫生,我们选择了此课题作为本科毕业设计题目。

   本次设计的豆干片自动上装排序系统主要包括两大部分:豆干片的自动排序和豆干片的自动落料填装。为实现此目的主要设计使用了两种主要机械装置:振动盘和气缸。通过对豆干片生产现状的了解,通过指导老师对本次设计的背景的介绍和设计目的及要求的说明讲解,通过查找翻阅有关书籍和网上查找相关信息和在指导老师的指导下,完成了本次设计各个部分的设计。

关键词:豆干片   自动上装   振动盘   气缸

The bean curd pieces automatic sorting system is a both familiar and strange mechanical system. With the bean food is getting more and more favors of all ages, the production process have been an integral part of development and improvement. In the domestic market now, there is no automatically upload mechanical sorting systems, in order to improve the production processes and the mechanization of food processing and to increase the labor efficiency and guarantee the hygiene of food, we’ve chosen this topic as a graduate design project.

The design mainly consists of two parts: the bean curd pieces automatic sorting and its automatic blanking. For this purpose, two main mechanisms are used: vibration plate and cylinder. Through understanding the production status and the background of this design and referring to the online information, I’ve completed the design under the guidance of instructor

Key words: bean curd pieces; vibration plate; cylinder; automatic upload

目  录  

前  言1

1 总体方案的制定2

1.1 设计目的和意义2

1.2 总体方案的确定3

2振动盘的设计5

2.2 振动盘的原理7

2.2.1 振动盘的原理分析7

2.3 振动盘的定向方法12

2.4单通道振动盘料斗的设计13

2.4.1 振动盘料斗设计13

2.4.2振动器设计16

2.5 双通道震动盘的设计20

2.5.1振动器设计22

2.7振动盘涂层27

2.8振动盘技术参数28

2.8 振动盘的调整步骤与要点29

3 滑道设计31

4 气动传动设计33

4.1 气压传动的系统分析33

4.1.1气压传动的组成及工作原理33

4.2.1 气缸的性能40

4.2.2缓冲装置44

4.2.3  连接与密封44

4.2.4  气缸筒与气缸盖的设计44

活塞与活塞杆46

气动装置的密封49

5.1 机架的概念及分类56

5.1.1 机架的概念56

5.1.2 机架按外形分类56

5.1.3 机架按制造方法和材料分类56

5.1.4 机架按力学模型分类56

5.2 机架设计的准则57

5.2.1 工况要求57

5.2.2刚度要求57

5.2.3强度要求57

5.2.4稳定性要求58

5.2.5美观58

5.2.6其他58

5.3 机架设计的一般要求58

5.4 机架的设计步骤59

5.5 机架结构选择的一般原则59

5.6 机架的设计与计算60

5.7 机架设计的技术要求61

致  谢62

参考文献64

   目前,食品安全是大家特别关注的一个问题,随着社会发展人们对食品营养,卫生,安全要求越来越严格。而人们在追求优质营养的时候很容易选择豆干,营养丰富,含有大量蛋白质、脂肪、碳水化合物,还含有钙、磷、铁等多种人体所需的矿物质。豆腐干在制作过程中会添加

食盐、茴香、花椒、大料、干姜等调料,既香又鲜,久吃不厌,被誉为“素火腿”。社会需求很大然而豆干的加工还是人工的,存在着很大的食品安全隐患,并且生产效率比较低。尤其在豆干片加工企业需要花费大量的人力劳动从而完成排序部分。所以说,本次豆干片自动上装系统设计,不管是对食品加工工业的发展还是对企业社会的利益增长都是具有重要价值和意义的。

   所以我们选择做豆干片自动上装系统总体设计,这次设计符合我们专业的培训目标,可以体现综合训练的要求,而且,本次设计题目符合现代社会食品加工工业的发展要求,是具有重大的现实价值。

   本次设计也是对我能力的一种考试,是检查自我是否是合格的本科毕业生的一次考核。道路是曲折的,前途是光明的。梅花香自苦寒来,宝剑锋从磨砺出。

    由于我国机械自动化,或者说是食品机械自动化还远远落后于发达国家,缺少成功的经验,同样,豆干片是我们的传统特色美食,国内外没有过自动上装的成功经验,所以我们在设计过程中没有成功案例可循,首次进行设计,由于实际生存知识的欠缺和设计经验的缺乏。还有许多地方不足和错误,希望老师指出指导!1.1 设计目的和意义

   豆干有抗氧化的功效。所含的植物雌激素能保护血管内皮细胞,使其不被氧化破坏。如果经常食用就可以有效地减少血管系统被氧化破坏。另外这些雌激素还能有效地预防骨质疏松、乳腺癌和前列腺癌的发生,是更年期的保护神。丰富的大豆卵磷脂有益于神经、血管、大脑的发育生长。比起吃动物性食品或鸡蛋来补养、健脑,豆干都有极大的优势,因为豆干在健脑的同时,所含的豆固醇还抑制了胆固醇的摄入。大豆蛋白可以显著降低血浆胆固醇、甘油三酯和低密度脂蛋白,同时不影响血浆高密度脂蛋白。所以大豆蛋白恰到好处地起到了降低血脂的作用,保护了血管细胞,有助干预防心血管疾病。所以在这个人们越来越追求食品营养安全的大氛围下,豆干越来越受亲睐。

   然而,豆干的生产包装却依然是人工排序上料。这影响了企业的生产,也威胁着这一行业的食品安全。所以做这个课题也是很迫切的任务。

2振动盘的设计

2.1 振动盘的发展过程振动盘的发展过程

国内振动机械新技术

a、预防长距离振动输送机产生弹性弯曲的新技术   

b、保持振动盘振动稳定的新技术   

c、消除构件焊接内应力的新技术   

d、防止螺钉和螺帽松动的新技术   

e、防止筛孔堵塞的技术   

f、提高筛面耐磨性的技术   

g、二次隔振减小传给基础振动的技术   

h、减少振动机起动通过共振振幅的技术

国内振动盘新产品

1) 激振器偏转式大型冷矿振动筛   

2) 惯性共振式概率筛   

3) 20-40米长的平衡加隔振动的大长度振动输送机   

4) 新型振动压路机   

5) 大宽度新型摊铺机   

6) 750吨振动沉拔桩机   

7) 实现振动同步传动的自同步振动给料机   

8) 双激振器自同步振动破碎机

国内振动盘发展展望

  A,大力加强研究振动盘理论与技术的研究, 一方面深入开展振动盘的基础理论与工作机理的研究, 如加强非线性振动机的理论, 振动的稳定性等, 另一方面加强实际技术的应用等,如筛面耐磨性和延长筛机寿命研究等   

B,应该大力开展振动盘实际应用的研究与开发工作, 扩大振动技术的应用领域与范围, 将振动盘广泛应用于各个领域和各种工艺过程.   

C,特别要加强振动盘技术与信息技术, 即多煤体技术,集成电路技术,光导纤维技术,网络技术和人工智能技术的结合, 使振动盘的理论与技术成为一种以智力为依托的高新技术.                                                     振动盘是振动式料斗的工作原理不同于机械传动的料斗,它借助于电磁力产生微小的振动,依靠惯性力和摩擦力的综合作用驱使豆腐干向前运动,并在运动中自动定向。

   这种料斗装置的主要优点:

   (1)送料和定向过程中没有机械的搅拌、撞击、和强烈的摩擦作用,因而工作稳定。对于柔软富有弹性的豆干用这种料斗是很合适的,因此我们采用振动盘作为筛选排序装置。

   (2)结构简单,易于维护,比较耐用。

   (3)通用性强。对于豆干形状的变化,我们只要稍作调整,就仍然可以使用。

  振动盘在使用中的缺点和局限性:

   (1)工作中有噪声,特别当豆干较大或结构参数设计得不合理时噪声尤大,以致扰乱周围工作环境。因此必须合理地设计和调整,使之减小和避免噪声,同时,振动盘对于尺寸和重量较大的豆干不甚合适。

   (2)必须保持料斗中洁净的工作环境,当有豆干碎渣时,必须给予清理,否则将影响送料速度和工作效果。

参考文献

[1] (美)杰佛里-布斯罗伊德《装配自动化与产品设计》,2009.3

[2] 肖旭霖.《食品机械与设备》.科学出版社,2006.1

[3] 华中工学院机械制造教研室.《机床自动化及自动线》.机械工业出版社,1981.3

[4] 洪钟德,《简明设计机械手册》.同济大学出版社,2002.5

[5] 梁珣,《Auto CAD2007绘图与辅助教程》.清华大学出版社,2007.2

[6] 武良臣 《互换性和测试技术》.北京邮电大学出版社,2009.8

[7] 马桃林 《包装技术》.武汉测绘科技大学出版社,1999.6

内容简介:
河南理工大学万方科技学院本科毕业设计(论文)中期检查表指导教师: 明平美 职称: 副教授 所在院(系): 机械与动力工程学院 教研室(研究室): 机械教研室 题 目BL系列台式车床进给结构学生姓名程向川专业班级07机制2班 学号0720150102一、选题质量:(主要从以下四个方面填写:1、选题是否符合专业培养目标,能否体现综合训练要求;2、题目难易程度;3、题目工作量;4、题目与生产、科研、经济、社会、文化及实验室建设等实际的结合程度)1. 在豆干片上装系统总体设计过程中,运用了在大学中所学的各种知识,通过设计加深了对所学知识的认识。选题符合专业培养目标,能体现综合训练要求。2通过这一个月的设计、计算,我感觉题目较难。3. 题目的工作量大,需要计算和考虑的东西较多,包括了振动盘尺寸计算,振动器的选用。二、开题报告完成情况:完成三、阶段性成果:1.英语翻译已经完成。2.论文以基本完成。3.正在绘图。四、存在主要问题:1.振动盘的设计的某些具体参数确定的约束条件不是太明确。2.参考资料较少。3.计算过程太过繁琐。五、指导教师对学生在毕业实习中,劳动、学习纪律及毕业设计(论文)进展等方面的评语指导教师: (签名) 年 月 日工程事故分析电梯传动轴的事故分析摘要在本研究中队电梯传动轴的事故分析作了详细的介绍。事故发生在轴的键槽上。微观结构、力学、和轴的化学特性已经定了。对断裂表面做出视觉调查以后得出结论断裂的产生是由于扭转的弯曲疲劳。疲劳裂纹已开始在键槽边缘。考虑到电梯以及驱动系统、力和力矩已决定作用在轴上;在失效面上的压力事故须进行计算。压力分析的实现还利用有限元法(FEM)和结果与计算值的比较。耐力极限和疲劳安全系数的计算,轴的疲劳周期分析进行了估计。失效原因的研究及分析得出破裂的发生是由于设计错误或键槽的制造(键槽角落较低的曲率半径造成高切口效应)。总之,曲率半径的变化对压力分别的影响可以用FEM解释,且必须采取预防措施防止透明的类似的失效。1. 简介本文研究的电梯传动轴已经被使用了30年。电梯驱动系统安装在建筑物的底部(图1)。据报道,在运行过程中无维护应用在轴上。电梯用于一个8层和16个套间组成的建筑里。电梯具有承载4个人(320kg)的能力。就在事故发生后,两个人离开了电梯,由于轴的突然断裂,皮带轮和电动发电机的连接被打破,从而导致发电机的制动系统失败。由于平衡重量变重,电梯以巨速上升。在事故中无人员受伤。2. 电梯驱动系统的分析在电梯驱动系统的分析得出转矩是由一个电动马达产生的,由螺旋轮传输给轴。电动发动机产生6.5HP,是1500转的旋转和螺旋轮的减速比为28.6。轴关键通过皮带轮旋转。电梯的四个主要绳索放在滑轮上且通过在驱动轴和滑轮方向旋转,电梯上下移动。电梯的服务速度是0.6m/s。轴是由三个方向上径向轴承的形式支撑的(图2)。3. 断口的视觉调查初级视觉调查后发现断裂发生在轴上皮带轮固定的键槽处(图3)。在分析断口(图4),检测到一个典型的扭转弯曲疲劳断裂面1。疲劳裂纹开始发生在键槽的角落,然后移动到差不多整个表面。脆性断裂面的小面积表明一个低的作用应力。检测到的疲劳线仅在脆性断裂地区。这可能由于摩擦表面的相互分离,导致形成疲劳线消失。4. 原料的特性由于没有有关可用化学成分轴材料的信息,事故分析的首要任务是材料的鉴定。确定轴材料、化学成分、机械性能和显微结构分析的进行。4.1. 化学分析轴的化学分析采用原子吸收光谱法,如表1报告。4.2. 微观结构轴材料的微观结构是由蚀刻,金刚石抛光后,用2%的Nitral溶解并在显微镜下观察(图5)。铁素体,珠光体和细晶粒结构可以清楚地看到。4.3. 机械性能拉伸和硬度试验来确定轴的机械特性,见表2。考虑到机械、化学和微观结构分析结果,轴材料估计为St52.0。张力,屈服,伸长率和硬度值依照DIN1629都是适合于St52.0的目录值2。5. 压力分析通过压力分析,调查发现最大和最小正常和剪切压力值发生在操作过程中的断裂面。起初,力和力矩作用在确定的轴上。通过分析最小压力值,只有空舱的重量(420kg)和平衡重量(580kg)考虑在内。在这种情况下,反作用力在断裂面处瞬间引起437.4 N m的弯曲度,作为20.6MPa的正压力值。剪切力,由于空舱、绳索和平衡重量的负载引起,形成了3.5MPa的剪切压力。通过分析最大压力值,平衡重量,四个人在内的客舱重量(每个人是80kg,且客舱的总重是740kg),扭转瞬间和冲击比是要考虑的。在这种情况下,571N m的弯曲力矩在断裂面发生并引起一个27MPa正常压力值。剪切压力值,由于剪切力,才是4.7MPa。6.5HP电动发动机旋转率是1500rot/min,螺旋齿的换算比率是28.6且驱动系统的效率是0.7。考虑到这些参量,扭力矩计算为887.7N m。总剪切压力在这种情况下作为25.7MPa计算。通过视觉检查后确定,从键槽范围到键槽侧面(角落)的过渡近似垂直的,并且没有观察到曲率半径(RC)(图6)。理论上,RC不能为零,它只能通过精铣刀具到达0.4mm的值3。因此,通过把RC看作0.4mm来计算,引起一个巨大的高切口的效果。理论的缺口效应在两个状态下(使用相关表4)分析;剪切缺口效应()被定义为2.93和弯曲缺口效应被定义为2.72。疲劳切口元素()考虑到几何学和轴的材料可以计算为4:其中?是缺口灵敏度元素且其值为0.854。使用方程(1)剪切疲劳缺口效应()计算为2.64并且标准疲劳缺口效应()为2.46。冲击比例系数被认为1.2。考虑到剪切和正向压力,冲击比例()和疲劳缺口效应,等效压力()使用“形状变形能量假说”计算5为:计算结果见表3。5.1. 疲劳强度分析轴材料的疲劳强度(耐力极限)计算为6考虑到大小因素(kD)当kD=0.77时直径为60mm且表面因素(精细抛光)kS=0.956;新的耐力极限计算为,从我们在知道平均压力值之前已经做的计算中()得出不为零。为确定对耐力极限的影响,我们必须知道或至少估计下。为了计算,我们必须考虑发生在断裂面处随时的压力值变化。但是这是相当困难的。通过我们做过的计算,我们估计最大和最小压力值。最小压力值出现在空舱位置和固定位置(速度为零)且没有加速度,通过电梯和四个人(每个人被认为是80kg)在客舱内加速到达最大压力值。但在现实中,运输在客舱内人的数量并不总是最大运输数量的人数(4)。因此,一个“变振幅压力”要视客舱内的人数发生在断裂面(图7)。每个最小峰值证明是在电梯不动和空载时压力在断裂面的值,最大峰值证明是压力值发生在载人电梯巡游时且考虑加速度。要计算平均压力,我们必须转变 “变振幅压力”为“恒振幅压力”通过假设最大压力值总是发生在断裂面处(通常运送四个人)。根据这一假设,压力值随时间的变化见图8。这种情况下平均压力值是108MPa。考虑到平均压力值,计算耐力极限之前需进行改进。通过分析,古德门的标准被考虑(图9)并改进耐力极限()计算为考虑到改进耐力极限()和等效压力(),疲劳安全系数()计算为5.2. 疲劳寿命分析从方程式(6)可以看出疲劳安全系数是相当的低()。对于详细的疲劳寿命分析,寿命周期通过下面的假设估计:大厦里所有电梯的唯一大约是八层楼21m。这栋建筑包括16个公寓。其中一半公寓是两个人,另外一半公寓是三个人居住。每个人每天使用电梯两次。电梯每年使用349天且轴可运行30年。滑轮的直径是400mm,被每个旋转的电梯移动1.257m。考虑到这些解释,电梯的总寿命大约是6.8106圈。为进一步的疲劳分析,轴的压力-圈数(S-N)曲线得以估计。为绘制轴的S-N的曲线,根据Juvinall和Shigley7,8,疲劳事故压力值在103圈时发生,由下式计算其中m=0.9是弯曲度。根据方程式(7)在Nf=103周期时压力值是512MPa。图中第二点是耐力极限值,其中钢为106圈。根据这些解释,估计的S-N图表见图10。通过低压力值和高周期疲劳,事故可能发生在106和107圈之间9。所以估算寿命6.8106圈数值为疲劳事故支持我们的论点。6. 有限元素分析为在键槽和断裂面检查压力分布,需应用有限元素分析(FEM)。通过使用分析ANSYS程序。建立了一个精确的轴几何模型。作为一个三维物体由于轴太长而不能完全被分析,只有键槽和断裂区进行了详细的建模(图11)。高压力区域,特别是在键槽角落,可以清楚地看到。上升对压力值的显著效果是低的曲率半径引起一个高的缺口效应。使用FEM进行压力分析的主要目的是核实我们以前所做的计算。从图11可以看出,断裂面的压力值接近计算值。7. 讨论通过增加曲率半径(RC)值,产生在键槽角落的压力值可有效降低。要确定RC在压力分布的影响,可使用有效元素分析。通过这种检查,RC-值的逐渐增加是为压力值减少的视觉分析,可见图12。键槽处压力值的剧烈增加清晰可见。对于进一步的研究,RC改变对压力和疲劳安全系数的影响详细分析见图13和14。通过从0.5mm到2mm增加曲率半径将减少压力值从163到104MPa和疲劳安全系数从1.05到1.78的增加。图13和14证实曲率半径的增加可能会预防电梯驱动轴的事故。总之,这确定轴断裂发生是由于错误设计或键槽的制造(曲率半径低),造成高缺口的影响。8. 小结一个电梯传动轴故障分析的详细调查。确定了轴的微观结构,机械和化学特性。做了断裂面的视觉调查之后得出结论是断裂的发生时由于扭转-弯曲疲劳。疲劳裂纹最初时在键槽的边缘。确定的作用在轴上的力和力矩;对发生在断裂面的压力进行了计算。计算了耐力极限和疲劳安全系数,估算了疲劳分析和轴的疲劳周期寿命。发生的轴断裂是由于错误设计或键槽的制造(曲率半径低),引起高缺口的影响。总之,曲率半径的变化对压力强度和分布的影响可使用FEM解释,并且必须采取预防措施组织类似透明的事故。Failure analysis of an elevator drive shaftA. Gksenli*, I.B. EryrekFaculty of Mechanical Engineering, Istanbul Technical University, Gmssuyu 34437, Taksim, Istanbul, Turkeya r t i c l ei n f oArticle history:Received 23 May 2008Accepted 25 May 2008Available online 11 June 2008Keywords:Drive shaftElevatorFailure analysisNotch effectFinite element methoda b s t r a c tIn this study failure analysis of an elevator drive shaft is analyzed in detail. Failure occurredat the keyway of the shaft. Microstructural, mechanical and chemical properties of theshaft are determined. After visual investigation of the fracture surface it is concluded thatfracture occurred due to torsional-bending fatigue. Fatigue crack has initiated at the key-way edge. Considering elevator and driving systems, forces and torques acting on the shaftare determined; stresses occurring at the failure surface are calculated. Stress analysis isalso carried out by using finite element method (FEM) and the results are compared withthe calculated values. Endurance limit and fatigue safety factor is calculated, fatigue cycleanalysis of the shaft is estimated. Reason for failure is investigated and concluded that frac-ture occurred due to faulty design or manufacturing of the keyway (low radius of curvatureat keyway corner, causing high notch effect). In conclusion effect of change in radius of cur-vature on stress distribution is explained by using FEM and precautions which have to betaken to prevent a similar failure is clarified.? 2008 Elsevier Ltd. All rights reserved.1. IntroductionThe elevator drive shaft investigated in this paper was in service for 30 years. Elevator drive system is mounted at thebottom of the building (Fig. 1). It is reported that no maintenance was applied on the shaft during operation life. The elevatoris used in a building consisting of eight floor and 16 apartments. The elevator has a four person (320 kg) capacity. Just beforethe accident, two persons were leaving the elevator and because of sudden fracture of the shaft, connection between pulleyand electric engine was broken, which lead the break system of the engine to fail. Due to the weight of balance weight, ele-vator lifted upwards with a huge speed. During the accident nobody was injured.2. Analysis of elevator drive systemDuring analysis of elevator drive system, it is concluded that torque, which is produced by an electric motor, is transmit-ted by a worm gear to the shaft. The electric engine, which produces 6.5 HP, is rotating 1500 rpm and reduction ratio of theworm gear is 28.6. The shaft rotates the pulley by a key. The four main ropes of the elevator are placed on the pulley and byrevolving in both direction of the drive shaft and pulley, the elevator moves up and down. Service speed of the elevator is0.6 m/s. The shaft is supported in three points in form of journal bearings (Fig. 2).1350-6307/$ - see front matter ? 2008 Elsevier Ltd. All rights reserved.doi:10.1016/j.engfailanal.2008.05.014* Corresponding author.E-mail addresses: goksenli.tr (A. Gksenli), eryurekb.tr (I.B. Eryrek).Engineering Failure Analysis 16 (2009) 10111019Contents lists available at ScienceDirectEngineering Failure Analysisjournal homepage: /locate/engfailanal3. Visual investigation of fracture surfaceAfter primary visual investigation it is revealed that fracture occurred at the keyway where the pulley is fasten at the shaft(Fig. 3).After analyzing fracture surface (Fig. 4), a typical torsional-bending fatigue fracture surface is detected 1. Fatigue cracksinitiated at the corners of the keyway and moved almost along the whole surface. The small area of brittle fracture surfaceindicates a low applied stress. Fatigue lines were detected only near to the brittle fracture region. This might be due to thefriction of two separated surfaces with each other, causing the formed fatigue lines to disappear.4. Properties of materialAs no information with respect to the chemical composition of the shaft material was available, the first task in the failureanalysis was the material identification. To determine shaft material, chemical, mechanical properties and microstructuralanalysis was carried out.Fig. 1. Elevator system inside the building.Fig. 2. Elevator drive system.1012A. Gksenli, I.B. Eryrek/Engineering Failure Analysis 16 (2009) 101110194.1. Chemical analysisThe chemical analysis of the shaft was carried out by atomic absorption spectroscopy and is reported in Table 1.4.2. MicrostructureThe microstructure of the shaft material was developed by etching, after diamond polishing, with 2% Nitral solution andwas observed under the microscope (Fig. 5). A ferriticpearlitic and fine grain structure can be clearly seen.4.3. Mechanical propertiesTensile and hardness tests were performed to determine the mechanical properties of the shaft which can be seen inTable 2.Considering mechanical, chemical and microstructural analyze results, shaft material is estimated as St52.0. Tensile, yield,elongation and hardness values are suitable for the catalogue values of St52.0 according DIN 1629 2.Fig. 3. Failed shaft.Fig. 4. Fracture surface.Table 1Chemical composition of the shaftC0.22Al0.012P0.031Si0.40Mn0.13S0.029A. Gksenli, I.B. Eryrek/Engineering Failure Analysis 16 (2009) 1011101910135. Stress analysisBy stress analysis, minimum and maximum normal and shear stress values occurring at the fracture surface during oper-ation is investigated. At first, forces and torques acting on the shaft are determined. By analyzing minimum stress value, onlythe weight of the empty cabin (420 kg) and balance weight (580 kg) is considered. In this case, reaction forces causes a bend-ing moment of 437.4 N m at the fracture surface resulting as normal stress value of 20.6 MPa. Shear forces, caused due to theloads of empty cabin, ropes and balance weights, forms a shear stress of 3.5 MPa. By analyzing maximum stress value, bal-ance weight, cabin weight with four persons inside (each person is 80 kg and the total weight of the cabin is 740 kg), torsionmoment and impact ratio is considered. In this case bending moment of 571 N m occurs at the fracture surface causing anormal stress value of 27 MPa. Shear stress value, due to shear force, is 4.7 MPa. The 6.5 HP electric engine rotates at1500 rot/min, conversion ratio of the worm gear is 28.6 and drive system efficiency (due to worm gear mechanism) is0.7. Considering these parameters, torsion moment is calculated as 887.7 N m. Total shear stress is calculated under thesecircumstances as 25.7 MPa.By visual examination it was determined that the transition from keyway ground to keyway side surface (corner) wasapproximately perpendicular and almost no radius of curvature (RC) was observed (Fig. 6).Theoretical, RC cannot be zero, it can only reach a value of 0.4 mm by fine milling cutter 3. Therefore by calculations RCis taken as 0.4 mm, causing an enormous high notch effect. The theoretical notch effect is analyzed in two states (using rel-evant tables 4); shear notch effect (aS) which is determined as 2.93 and bending notch effectaBis determined as 2.72. Fa-tigue notch factor (b) considering geometry and material of the shaft can be calculated as 4:b 1 a? 1 ?g1Fig. 5. Microstructure of the shaft material (?200).Table 2Mechanical properties of the shaftYield strength (MPa)Tensile strength (MPa)Rapture elongation (%)Hardness (BHN)33956918165Fig. 6. Failed shaft and fracture surface.1014A. Gksenli, I.B. Eryrek/Engineering Failure Analysis 16 (2009) 10111019wheregis notch sensitivity factor and its value is 0.85 4. Using Eq. (1) shear fatigue notch effect (bS) is calculated as 2.64and normal fatigue notch effect (bN) as 2.46. Impact ratio coefficient is taken as 1.2. Considering shear and normal stresses,impact ratio (q) and fatigue notch effects, equivalent stress (rEQ) is calculated using Shape Deformation Energy Hypothesis”5 asrEQffiffiffiffiffiffiffiffiffiffiffiffiffiffiffiffiffiffiffiffiffiffiffiffiffiffiffiffiffiffiffiffiffiffiffiffiffiffiffiffiffiffiffiffiffiffiffiffiffiffiffiffiffiffiffiffiffiffiffiffir?q? bN2 3 ?s?q? bS2q2The summarized results can be seen in Table 3.5.1. Fatigue strength analysisFatigue strength (endurance limitrE) of the shaft material was calculated as 6rE 0:5 ? UTS 0:5 ? 568 284 MPa3Considering size factor (kD) for 60 mm diameter as kD= 0.77 and surface factor (fine polished) kS= 0.95 6; the newendurance limitrIE?is calculated asrIErE? kS? kD 284 ? 0:77 ? 0:95 208 MPa4rIE 208 MPa. From our calculations done before we know that average stress value (rM) is not zero. To determine theeffect ofrMon endurance limit, we have to know or at least to estimaterM. To calculaterM, we have to consider the changeof stress value occurring at the fracture surface in time. But this is quite difficult. By our calculations done before we calcu-lated maximum and minimum stress values. Minimum stress value occurred at empty cabin and stationary position (veloc-ity is zero) and with no acceleration, maximum stress value by acceleration of the elevator and four persons (each person isassumed to be 80 kg) inside the cabin. But in real, number of persons transported inside the cabin is not always the maxi-mum transportation number of person (four). Therefore a Variable-amplitude stress” occurs at the fracture surface depend-ing on the number of persons inside the cabin (Fig. 7).Each minimum peak demonstrates the stress value at the fracture surface at the time the elevator is not moving and isempty, each maximum peak demonstrates the stress value occurring at the time of cruise of the elevator with person(s) in-side the cabin and considering acceleration.To calculate average stress value, we have to transform Variable-amplitude stress” into Constant-amplitude stress” byassuming that always maximum stress occurs at the fracture surface (always four persons are transported). According to thisassumption, change of stress value versus time can be seen in Fig. 8. In this case average stress value is 108 MPa.Considering average stress value, before calculated endurance limit is modified. By the analysis, criteria of Goodman 6 isregarded (Fig. 9) and modified endurance limitrIIE?is calculated asrIIErIE? 1 ?rM=UTS 208 ? 1 ? 108=569 1705Considering modified endurance limitrIIE?and equivalent stress (rEQ), fatigue safety factor (t) can be calculated astrIE=rEQ 170=162 1:0565.2. Fatigue life analysisFrom Eq. (6) can be seen that fatigue safety factor is quite very low (t= 1.05). For detailed fatigue life analysis, life cycle isestimated by following assumptions: The total elevator displacement inside the building is by eight floors approximately21 m. The building consists of 16 apartments. In half of the apartments there are two and other half there are three personsliving. Each person is using the elevator twice a day. The elevator has been used 340 days in a year and shaft is in operationfor 30 years. The diameter of the pulley is 400 mm and by each rotation the elevator is moving 1.257 m. Considering theseexplanations, total life of the shaft was approximately 6.8 ? 106cycles.For further fatigue analysis, stress-cycle (SN) curve of the shaft is estimated. To draw the SN curve of the shaft, accord-ing to Juvinall and Shigley 7,8, stress value (rF) where fatigue failure cycle at 103cycles occur, can be calculated asrF m ? UTS7Table 3Stress, force and torque values occurring at the fracture surface during operationNormal stress (MPa)Shear stress (MPa)Equivalent stress (MPa)Shear forceTorqueTotalMinimum50.69.29.254Maximum79.715.167.382.4162A. Gksenli, I.B. Eryrek/Engineering Failure Analysis 16 (2009) 101110191015where m = 0.9 for bending. The stress value at Nf= 103cycles according Eq. (7) is 512 MPa. The second point at the graphis the endurance limit value, which is 106cycles for steel. According to these explanations, estimated SN diagram can beseen in Fig. 10.By low stress values and high cycle fatigue, failures can occur between 106and 107cycles 9. Therefore estimating lifecycle value of 6.8 ? 106cycles for fatigue failure supports our thesis.Fig. 7. Stresstime graphic acting on the fracture surface depending on the number of persons inside the cabin (Variable-amplitude load).Fig. 8. Stresstime graphic acting on the fracture surface (Constant-amplitude load).Fig. 9. Determining modified endurance limit considering average stress value of 108 MPa (according to Goodman).1016A. Gksenli, I.B. Eryrek/Engineering Failure Analysis 16 (2009) 101110196. Finite element analysisTo examine stress distribution at the keyway and fracture surface, finite element method (FEM) was applied. By the anal-ysis ANSYS program was used. A precise geometrical model of the shaft was built up. Since the shaft is too long to be ana-lyzed completely as a three-dimensional object, only the keyway and fracture region was modeled in detail (Fig. 11).High stress regions, especially at the corner of the keyway can be clearly seen. The dominant effect of the raise in stressvalues is the low radius of curvature causing a high notch effect. The aim of stress analysis using FEM was to verify our stresscalculations done before. From Fig. 11 can be seen that stress values at the fracture surface were close to the calculated ones.7. DiscussionBy increasing radius of curvature (RC) value, stresses occurring at the keyway corner could be decreased effectively. Todetermine the effect of RC on stress distribution, finite element analysis is carried out. By this examination, RC-value wasincreased stepwise for visual analysis of decrease in stress values, which can be seen in Fig. 12.Dramatic decrease of stress values at keyway corner can be clearly seen. For further investigation, the effect of change inRC on stress and fatigue safety factor is analyzed in detail which can be seen in Figs. 13 and 14.By increasing radius of curvature even from 0.5 mm to 2 mm would decrease stress value from 163 to 104 MPa and anincrease in fatigue safety factor from 1.05 to 1.78. Figs. 13 and 14 demonstrate that an increase of radius of curvature wouldFig. 10. Estimated stress-cycle diagram.Fig. 11. Finite element mesh of the shaft.A. Gksenli, I.B. Eryrek/Engineering Failure Analysis 16 (2009) 101110191017probably prevent the failure of the elevator drive shaft. In conclusion it is determined that fracture of the shaft occurred dueto faulty design or manufacturing o
温馨提示:
1: 本站所有资源如无特殊说明,都需要本地电脑安装OFFICE2007和PDF阅读器。图纸软件为CAD,CAXA,PROE,UG,SolidWorks等.压缩文件请下载最新的WinRAR软件解压。
2: 本站的文档不包含任何第三方提供的附件图纸等,如果需要附件,请联系上传者。文件的所有权益归上传用户所有。
3.本站RAR压缩包中若带图纸,网页内容里面会有图纸预览,若没有图纸预览就没有图纸。
4. 未经权益所有人同意不得将文件中的内容挪作商业或盈利用途。
5. 人人文库网仅提供信息存储空间,仅对用户上传内容的表现方式做保护处理,对用户上传分享的文档内容本身不做任何修改或编辑,并不能对任何下载内容负责。
6. 下载文件中如有侵权或不适当内容,请与我们联系,我们立即纠正。
7. 本站不保证下载资源的准确性、安全性和完整性, 同时也不承担用户因使用这些下载资源对自己和他人造成任何形式的伤害或损失。
提示  人人文库网所有资源均是用户自行上传分享,仅供网友学习交流,未经上传用户书面授权,请勿作他用。
关于本文
本文标题:豆干片自动上装系统总体设计【4张CAD图纸】【优秀】
链接地址:https://www.renrendoc.com/p-291925.html

官方联系方式

2:不支持迅雷下载,请使用浏览器下载   
3:不支持QQ浏览器下载,请用其他浏览器   
4:下载后的文档和图纸-无水印   
5:文档经过压缩,下载后原文更清晰   
关于我们 - 网站声明 - 网站地图 - 资源地图 - 友情链接 - 网站客服 - 联系我们

网站客服QQ:2881952447     

copyright@ 2020-2025  renrendoc.com 人人文库版权所有   联系电话:400-852-1180

备案号:蜀ICP备2022000484号-2       经营许可证: 川B2-20220663       公网安备川公网安备: 51019002004831号

本站为文档C2C交易模式,即用户上传的文档直接被用户下载,本站只是中间服务平台,本站所有文档下载所得的收益归上传人(含作者)所有。人人文库网仅提供信息存储空间,仅对用户上传内容的表现方式做保护处理,对上载内容本身不做任何修改或编辑。若文档所含内容侵犯了您的版权或隐私,请立即通知人人文库网,我们立即给予删除!