文献翻译.doc

围板包装箱自动化生产线铆接装置的设计【优秀】【带UG三维】【word+8张CAD图纸】【毕设】

收藏

资源目录
跳过导航链接。
围板包装箱自动化生产线铆接装置的设计【优秀】【word+8张CAD图纸】【毕设】.rar
计划周记进度检查表--仅供参考.xls---(点击预览)
文献翻译.doc---(点击预览)
开题报告.doc---(点击预览)
任务书.doc---(点击预览)
0923108-张亚卫-围板包装箱自动化铆接装置的设计.doc---(点击预览)
PDF打印图
UGsanweimoxing
010200.prt
dangban11.prt
jaiolianmmmm.prt
jiaolian.prt
jiaolianchuansonl5.prt
maojiejigou 008.prt
maotou.prt
mirror_01000001.prt
mirror_904.prt
model10.prt
model12.prt
model17.prt
model18.prt
model3.prt
zhengtijiegoumouxing.prt
zuankonmao.prt
zuantou.prt
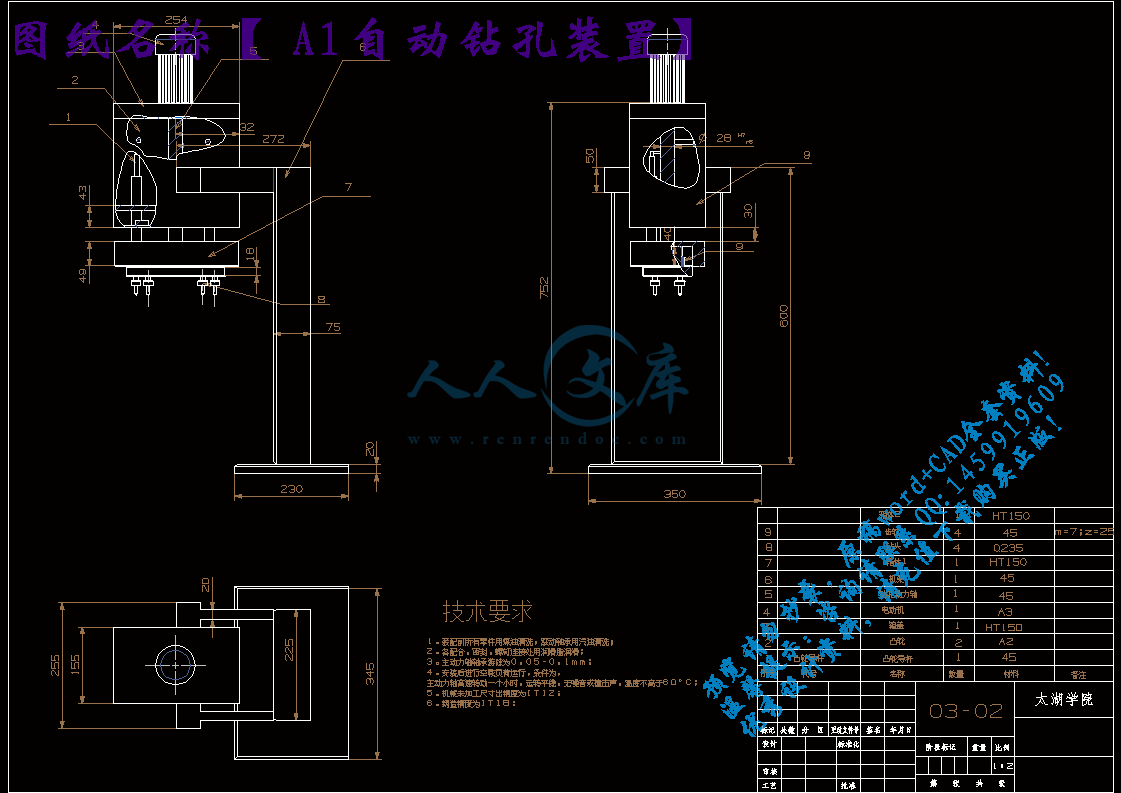
A1自动钻孔装置.dxf
A1自动铆接装置.dxf
A3大齿轮.dxf
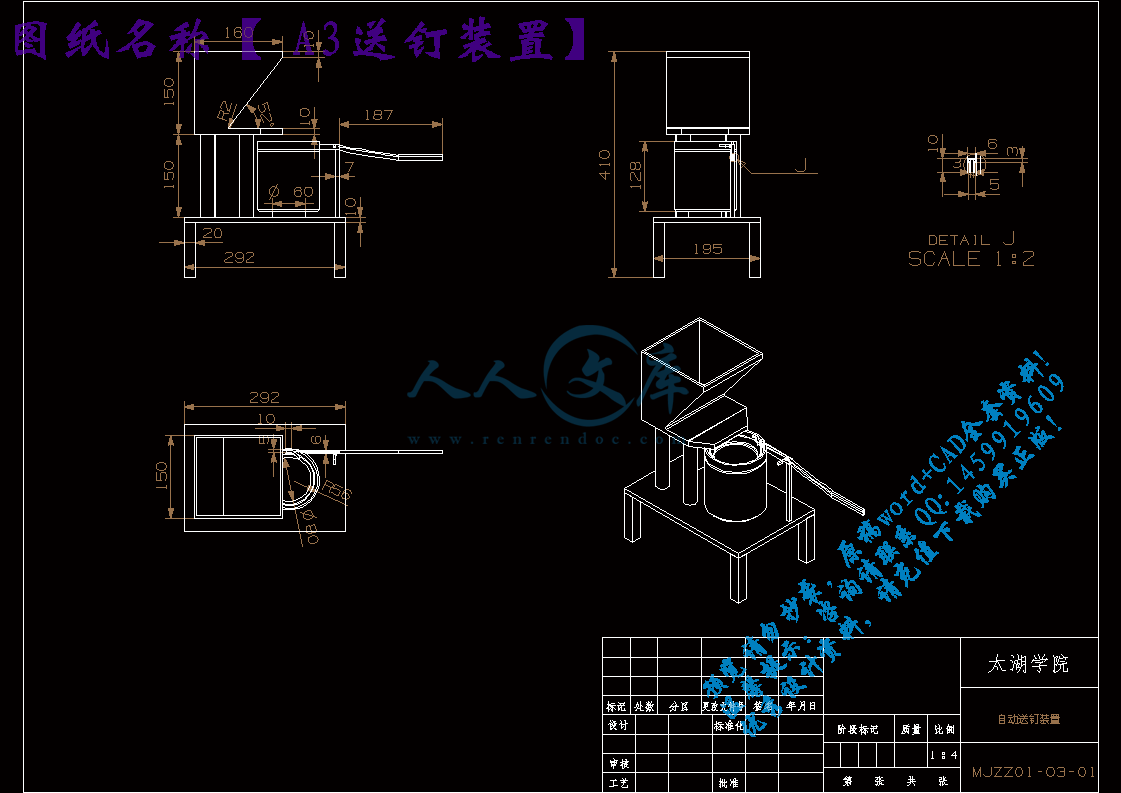
A3送钉装置.dxf
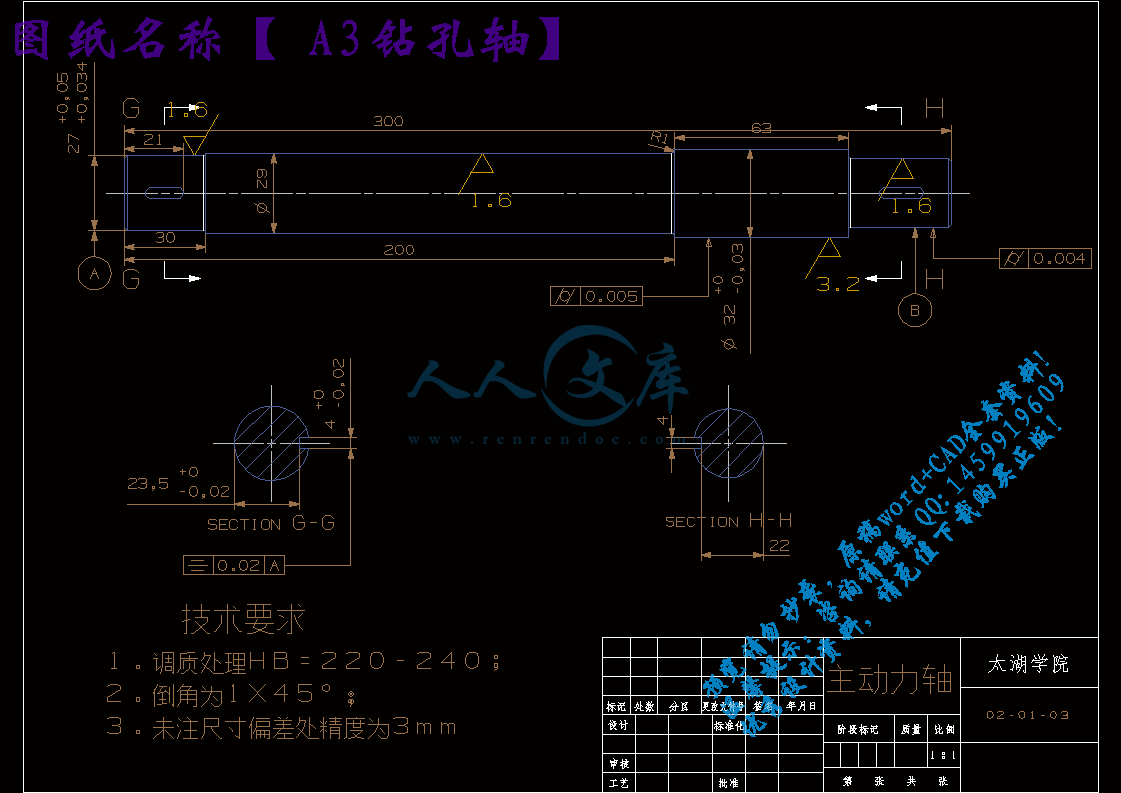
A3钻孔轴.dxf
A3铆接轴.dxf
A4小齿轮.dxf
整体设计A0.dxf
压缩包内文档预览:
预览图 预览图 预览图 预览图 预览图 预览图 预览图 预览图 预览图 预览图 预览图 预览图 预览图
编号:313635    类型:共享资源    大小:7.31MB    格式:RAR    上传时间:2014-08-18 上传人:QQ14****9609 IP属地:陕西
50
积分
关 键 词:
围板包装箱 包装箱 自动化 生产线 铆接 装置 铆接装置
资源描述:

围板包装箱自动化生产线铆接装置的设计【优秀】【word+8张CAD图纸】【毕业设计】

【带任务书+开题报告+外文翻译】【45页@正文24900字】【详情如下】【需要咨询购买全套设计请加QQ1459919609】.bat

围板包装箱自动化铆接装置的设计正文.doc

A1自动钻孔装置.dxf

A1自动铆接装置.dxf

A3大齿轮.dxf

A3送钉装置.dxf

A3钻孔轴.dxf

A3铆接轴.dxf

A4小齿轮.dxf

PDF打印图

UGsanweimoxing

任务书.doc

开题报告.doc

整体设计A0.dxf

文献翻译.doc

计划周记进度检查表--仅供参考.xls

任 务 书

一、题目及专题:

题目  围板包装箱自动化生产线铆接装置的设计

二、课题来源及选题依据

课题来源:工厂

选题依据:围板箱是由托盘、箱体和箱盖三部分组成,组成每层围板的四片木板用铰链连接。由于装箱的灵活性、对装载物的适应性和重复使用性,围板箱被广泛应用与机械、化工、电子、五金一集其他领域的物流配送,具有能回收、降低成本、环保等优点。

作为产品外包的物流设施,围板箱越来越受客户的欢迎,使用量巨大。然而, 现有的围板箱生产方式落后, 在生产中人为因素较大,这使得围板箱的生产上存在着生产效率低,质量不稳定等缺陷。 这严重影响着围板箱的应用。为了提高劳动生产率, 降低工人劳动强度, 节约生产成本, 我们对围板箱的现有生产工艺进行了研究,设计出了适应与围板箱生产的围板自动化生产线铆接装置。

三、本设计(论文或其他)应达到的要求:

① 熟悉围板包装箱加工的发展历程,以及近几年对围板包装箱生产工艺的改进方法

② 熟练掌握用UG 绘制三维模型的方法

③了解近几年对围板箱生产工艺的改进

④设计出合理的围板包装箱自动化生产线铆接装置

摘  要

   围板箱作为产品外包的物流设施,具有可重复使用,能回收、降低成本、环保等优点。且越来越受客户的欢迎,使用量巨大。然而,现有的围板箱生产方式落后,并且在生产中人工所占工作量较大,这使得围板箱的生产上存在着生产效率低,劳动强度高以及质量不稳定等隐患,严重影响着围板箱推广和应用。为了提高劳动生产率,降低工人劳动强度,节约生产成本,我们对围板箱的现有生产工艺进行了分析研究,对现有工艺进行综合、设计,设计出了适应与围板箱生产的自动化生产线铆接装置。本文就自动铆接装置的设计做以下说明。

   1) 通过对现有围板箱生产工艺的分析研究,并结合实际生产过程中对围板箱生产上的要求,提出了对围板包装箱生产工艺的改进方案,通过比较,分析其合理性和可行性。

   2) 将所设计的围板包装箱自动化生产机构分成七大部分,并以凸轮技术为基础,分别进行设计,通过试验分析最终完成了自动钻铆机的设计。

   3) 设计完成以后,利用三维建模软件UG建立了自动钻铆机中的钻孔、钻铆系统的三维实体模型,包括弧面凸轮转位机构,铆接机构等。

   4) 利用动力学分析软件ADAMS对弧面凸轮转位机构的虚拟样机进行了运动学分析,得出了工作时的铆接筒的转位角速度、角加速度。这为弧面凸轮分度机构的优化提供了参照。

   利用建立的铆接系统中的转位机构、钻孔机构的虚拟样机,进行了仿真

分析,得到了机构中从动件的运动规律及受力情况,这对我们在进行围板包装箱 自动化生产线铆接装置的设计及机构的修改有一定的指导意义,也为我们的设计节省了时间,减少了经济损失。

关键词:围板箱,自动钻孔、铆接装置,凸轮机构

Abstract

   Coaming box as product outsourcing logistics facilities, is a reusable, can recycling, reduce cost, environmental protection, etc. And more and more popular with customers, huge usage.however, the existing coaming box backward production mode, and in the production of artificial workload is bigger, which makes the coaming box production there is a low production efficiency, high labor intensity and the quality is not stable etc, seriously affecting the coaming box promotion and application. In order to improve the labor productivity, reduce the workers labor intensity, saving the production cost, our existing to coaming box, this paper analyzes the production technology, comprehensive, design of the existing technology, designed the coaming box production to adapt to a riveting device of the automatic production line. In this paper, the design of automatic riveting device to do the following instructions.

    1) through the analysis of the existing coaming box production technology research, and combining the actual production process to coaming box production request, proposed to the coaming packing production process improvements, through the comparison, analysis of its rationality and feasibility.

   2) to the design of the automatic drilling and riveting machine is divided into seven parts, and on the basis of CAM technology, design, respectively, through the test analysis finally completed the design of the automatic drilling and riveting machine.

   3) after the completion of the design, the use of three-dimensional modeling software UG to establish the automatic drilling and riveting machine in the virtual prototype model of drilling and riveting system, including the curved CAM indexing mechanism, riveting, etc.

   4) using dynamic analysis software ADAMS to curve of CAM indexing mechanism, the authors carried out a kinematical analysis on the virtual prototype, the work is obtained when the riveting tube inversion angular velocity and angular acceleration. For the curve of CAM indexing mechanism that provides reference to optimization.

   Of riveting system with built in indexing mechanism, the drilling mechanism of virtual prototype and simulatedAnalysis, obtained the institutions of follower motion law and force, it in the coaming for our packing automatic production line riveting device design and mechanism of modification has certain guiding significance, as well as our design saves time, reduces the economic loss.

Key words: coaming box, automatic drilling and riveting equipment, the CAM mechanism

目  录

摘  要III

AbstractIV

目  录V

1. 绪论1

1.1 对围板包装箱生产工艺方法的分析及意义1

1.2 国内外的发展概况1

1.3 围板箱的组成及优点2

2. 围板箱生产线的工艺分析3

2.1 围板箱生产现状的介绍3

2.2对围板加工工艺方法的确定4

3. 围板包装箱自动化生产工艺的设计要求及整体结构的分析6

3.1 围板包装箱自动化生产线铆接装置的设计要求6

3.2 自动化钻孔铆接技术的概述6

3.3 围板包装箱自动化铆接装置设计的整体结构分析6

3.3.1 整体机构的分析6

3.3.2 总体结构的设计7

3.4 围板包装箱自动化铆接装置的工作循环分析8

3.4.1 钻孔机构的工作循环8

3.4.2 弧面凸轮分度机构的工作循环8

3.4.3 铆接机构的工作循环8

3.4.4 压紧机构的工作工作循环8

3.4.5 送钉机构的工作循环8

4.围板包装箱自动化生产线主体结构的设计9

4.1 钻孔机构的结构设计9

4.2 铆接机构的设计10

4.3主动力轴的设计和校核及齿轮传动系统的设计14

4.3.1 主动力轴的设计和校核14

4.3.2 齿轮传动系统的设计16

4.3.3 钻孔机构齿轮系统的设计与计算17

4.3.4 铆接机构齿轮系统的设计与计算20

5. 弧面分度凸轮机构的设计21

5.1 弧面分度凸轮机构的结构分析21

5.2 弧面凸轮具体参数的确定22

5.2.1 分度数及分度角的计算22

5.2.2 动静比K和凸轮动程角22

5.2.3 计算中心距22

5.2.4 计算凸轮的滚子尺寸23

5.2.5 从动盘的尺寸23

5.2.6 凸轮尺寸的确定23

6. 凸轮机构的设计24

6.1 凸轮机构的设计要求及结构方案的确定24

6.2钻孔、铆接工艺加工过程的分析24

6.3钻孔凸轮及铆接凸轮结构的设计和分析24

6.3.1凸轮机构分析24

6.3.2 凸轮机构中个参数的确定25

6.5 沟槽凸轮理论轮廓的设计26

7.送钉机构压紧机构的设计及工作原理28

7.1压紧机构的设计及工作原理28

7.2 送钉系统的结构设计和工作原理28

7.2.1 送钉装置结构组成28

7.2.2 铆钉的种类和规格29

7.2.3 自动供钉装置的功能需求30

7.2.4 自动供钉装置的结构组成30

7.2.5 铆钉整理定向模块31

7.3 送钉原理介绍32

7.3.1 大压块的设计32

7.3.2 搓板的设计33

8. 动力系统的分析34

8.1 钻孔铆接机构动力系统分析34

8.2 电动机转速的确定35

8.3 V带传动的设计及相关的参数计算36

8.3.1带传动受力分析36

8.3.2 带传动的最小初拉力和临界摩擦力36

8.3.3 带的应力分析37

8.3.4带传送设计计算38

9. 总结与展望39

9.1 总结39

9.2 展望39

致  谢40

参 考 文 献41

1. 绪论

1.1 对围板包装箱生产工艺方法的分析及意义

  在循环包装系统里,方便灵活的围板箱有着无可比拟的优势。这是一种标准的物流器具,损坏的顶盖与侧板很容易进行替换,整体循环包装系统的投资比较低廉,而使用寿命则可达十年之久,这也是一种可靠的坚固的可以折叠的包装系统。由于装箱的灵活性、对装载物的适应性和重复使用性,围板箱被广泛运用于机械、化工、电子、五金以及其他领域,围板包装箱作为产品外包的物流设施,越来越受客户的欢迎,使用量巨大。然而,现有的围板箱生产方式落后, 在生产中人为因素较大,这使得围板箱的生产上存在着生产效率低, 质量不稳定等缺陷,这严重影响着围板箱的应用。针对现有围板工艺生产方法进行改进,设计出适用于围板生产的围板自动化生产线铆接装置,提高劳动生产率,降低工人劳动强度,节约生产成本。

1.2 国内外的发展概况

围板包装箱作为产品的外包物流设备具能够重复使用,可回收、降低运输成本、环保等优点。在运输产品方面受到广泛的运用,需求日益增加。现有的围板箱生产方式落后,并且在生产中人为因素较大,这使得围板箱的生产上存在着生产效率低,质量不稳定等缺陷,严重影响着围板箱的应用。

在国内,围板箱是一款可反复循环使用的新型包装,适用于紧固件、金属球、冲压件等不规则产品的包装,是出口到欧洲的产品包装的不二选择。围板箱基本以木板为主要材料,而侧板大多数都是采用模板或者大板制作,使得材料的选取过于苛刻,而且成本比较高。目前围板箱的生产也主要以人工为主,木板加工以半自动化为主,因此在生产中人为因素较大,这就导致围板箱的生产上存在着生产效率不高, 质量不稳定等缺陷,影响了围板的推广和运用。而在国外,德国KTP公司可以说是制造围板箱的代表,经过其几代人的努力,现今已经研制出了可折叠式塑料围板箱如图1.1所示。其生产方式也采用了全自动化的生产线模式,箱子规格也都已经基本标准化,方便统一规格生产。

参 考 文 献

刘朝儒,彭福荫,高政一.机械制图[M],北京:高等教育出版社.2001.

王文斌.机械设计手册[M],北京:机械工业出版社,2004.

铁位麟.机床备件手册[M],北京:机械工业出版社.1992.

曹惟庆,徐曾荫.机构设计[M],北京:机械工业出版社.1994.

刘加利.弧面凸轮设计与精密加工的研究[D],山东淄博:山东理工大学,2006.

张建民.机电一体化系统[M],北京:北京理工大学出版社.2000.

张力勋,孟庆鑫.机电一体化系统设计[M],哈尔滨:哈尔滨工程大学出版社.1990.[8]

严道发.电主轴技术综述[J].机械研究与应用,2006(12),V01.19 No.6:1~3.

吴武辉.球齿轮数控磨齿机结构设计与分析[D].湖南:国防科学技术大学机械工程,2007.

周延,李中行.电主轴的电动机及其驱动模块[J].制造技术与机床,2003(9):86~87.

曹巨江,陈雪峰.弧面凸轮诱导主曲率与接触应力[J].机械设计,2001,(11):10~11.

白银科,曹西京.磁性研磨在弧面凸轮加工中的应用[J].组合机床与自动化加工技术2009,(9):82~85.

徐芝纶.弹性力学(第三版)上册.北京:高等教育出版,1999.

张海波.基于虚拟样机技术的自卸汽车作业稳定性研究[D],青岛:青岛大学,2008.

刘加利.弧面凸轮设计与精密加工的研究[D].山东淄博:山东理工大学,2006.

刘言松,贺伟.弧面凸轮三维实体模型的建立[J].组合机床与自动化加工技术,2004,36~37.


内容简介:
中文译文4.3 在喷油螺杆压缩机的流量 4.3.1 网格生成的油润滑压缩机 阳极和阴极的转子有40个数值细胞沿各叶片间的圆周方向,6细胞在径向和轴向方向上的112。这些形式为转子和壳体444830细胞总数。为了避免需要增加网格点的数量,如果一个更精确的计算是必需的,一个适应的方法已应用于边界的定义。 时间变化的数量为25,在这种情况下,一个内部循环。的对阳极的转子转一圈所需的时间步骤的总数是那么125。在转子中的细胞数为每个时间步长保持相同。以实现这一目标,一个特殊的网格移动程序开发中的时间通过压缩机转速的确定步骤,正如4章解释。对于初始时间步长的数值网格图4-15提出。 图4数值网格喷油螺杆压缩机444830细胞4.3.2数学模型的油润滑压缩机 数学模型的动量,能量,质量和空间方程问题,如第2.2节所描述的,但一个额外的方程的标量属性油的浓度的增加使石油对整个压缩机性能的影响进行计算。本构关系是一样的前面的例子。石油是一种被动的物种在模型处理,这不混合液体-空气的背景。对空气的影响占通过物质和能量的来源是加上或减去的主要流模型相应的方程。在这种情况下,动量方程通过拖曳力的影响如前所述。 建立工作条件和从吸气开始全方位1巴压力获得6,7压力的增加,8和9条近450000细胞放电,数值网格对于每一种情况下只有25时间步骤来获得所需的工作条件,其次是进一步的25的时间的步骤来完成一个完整的压缩机循环。每个时间步所需的约30分钟的运行时间在一个800 MHz的AMD 速龙处理器计算机内存需要约450 MB。4.3.3对油的数值模拟和实验结果的比较淹没式压缩机 在压缩机中的腔室,在压缩机内的循环的实验得到的压力历史和测得的空气流量和压缩机功率的情况下,测量的速度场担任了宝贵的基础,以验证CFD计算的结果。要获得这些值, 5/6喷油压缩机中,已经描述的,测试安装在压缩机实验室在城市大学伦敦,如图4-16上的钻机。4-16喷油螺杆空气压缩机5 / 6-128mm(= 90mm)在测试床4.3流的喷油螺杆压缩机 该试验台满足螺杆压缩机的接受所有pneurop /程序的要求试验。压缩机是根据ISO 1706和交付流程测试测定了BS 5600。高质量的压力传感器测量的压力,与在入口带到压缩机的读数,从压缩机排出和在分离器。温度是通过热电偶测量FeCo入口和放电从压缩机、油分离器后。测量透射电子显微镜温度也被两个,油和冷却水的入口端油冷却器。从冷却器和压缩机的油流量的计算能量和质量平衡。通过实验室型转矩仪传感器测量扭矩的IML色氨酸500连接发动机和压缩机驱动轴之间。压缩机是由一个100千瓦的柴油发动机的最大输出驱动,这可能在可变速度操作。测得的是压缩机的转速频率计、信号转换为电流后,转移到一个数据记录器。图4-17电脑屏幕上的压气机试验台的测量程序 压缩机流量测量到BS 5600与所述的孔板通过压力换能器的PDCR 120/35WL超过压差测量经营范围为0200千帕所有相关的脉动量的测量值被用于获得的热力学循环的细节。 这些,在截留容积的压力应用是最重要的,因为它需要绘制机器的PV图。因此,从开发建设的整个光伏图仅需4离散点在机器外壳的压力变化的记录。ENDEVCO压阻式传感器, E8180B被用于测量瞬时同时压缩机中的绝对压力值。每个传感器重新有线的压力在一个叶片空间。从开始的吸入端, 4反式生产者被定位在所述压缩机壳体的变化记录在每个连续叶片空间。当绘制顺序,他们给了压力 - 时间整个压缩机工作循环的图。在两个压缩机的横截面图4-18速度矢量图4 18速度矢量在两个压缩机横截面前截面由不得通过吸入口,底部截面B-B 所有测量值被自动记录和转移到个人电脑通过一个高速InstruNet数据记录器。 数据采集系统启用高速测量的频率以超过2千赫。 收购和测量程序的电脑是写给这在Visual Basic,允许在线测量和计算,压缩机工作参数。 一个电脑屏幕上记录的测量程序给出了图4 17。在图4-18中,在两个横截面的速度矢量。其中一个这些是通过进气口和油喷射管,另一个是靠近排出。图4-19示出了在通过压缩机的垂直截面中的速度。高的速度值的差距,两者之间的转子和他们的住房和两个转子之间,所产生的尖锐的压力梯度通过的间隙。这些有清楚区别的速度在叶片间区域其中的流体流动相对缓慢。引起的流体流有仅由运动的数值网格,这是产生的方式,以跟随的运动在时间上的转子。最上方的图显示了通过的吸入口和油喷射开口的横截面。再循环吸入口是巨大的,因为油的位置,似乎是高喷射孔。如果油注入已进一步向下游的位置,再循环已经减少。底部的图,它示出了横靠近排放口部分,表明更多的再循环环存在于叶片与较低压力下,如在该图的顶部可见。在高压区域进行平滑处理的速度相对较低的值,类似的壁的速度在一定程度上。在轴向截面C-C速度场,它穿过转子沿转子内尖,在图4-19所示图4-19速度矢量在压缩机轴向截面CC 平滑的速度是在高压力区域中可见的右端的图像。在压缩机的上部,其中,低压力和低气压梯度时,流态多弯曲,从而表明流漩涡。也有在吸入口的远端再循环的同时,在同时,流经端口的轴向的一部分是更密集 在截面A-A的油分布和压力场被显示在顶部和底部图分别如图4-20所示。如前所述,一些流体再循环从工作腔的吸入口通过压缩机间隙。图4-20表示,与空气一起,油从逸出加压工作腔室的吸入口,通过转子到转子漏路径。在吸入口的油的存在下也肉眼观察期间这种压缩机的测试。然而,没有测量,用其制成的。图4-20截面通过入口和喷油口A-A油顶质量浓度,底压力分布 一些有限的结果,在油分布的实验研究兴等人(2001 )公布的螺杆式压缩机。在这种情况下,油流观察到通过使由透明材料制成的压缩机壳体。虽然作者没有完整地记录了他们的结果,它似乎从什么他们出版的3-D计算所得到的油流模式在他们的实验中获得的那些类似。在吸入口的热油的存在下,虽然有益的转子的润滑,增加了气体的工作腔室的温度,然后再关闭。这减少了被困的质量因此压缩机的容量,是另一个的影响不由螺杆压缩机的过程的一维模型,建模。图4-21显示了在压缩机内的压力分布与阳极转子转速为5000rpm 。这个数字表示内的压力的每个工作腔几乎是均匀的,并且其可以被视为例如几乎所有的计算和比较。由于这个原因,所得到的结果的3-D计算可以与从测量得到的那些相比。图4-21两个转子之间的轴向部分 - 压力分布 在工作腔的内压力的变化,如图4-22所示,作为一个阳转子轴角度的功能。这里的压力轴角图与从压缩机测试结果相比。结果显示放电的压力是 6,7, 8和9巴绝对压力在轴速度为5000rpm 。在所有情况下,进气压力为1巴。预测和之间的协议测量值是合理的,尤其是在压缩过程中。一些差异被记录在吸入和排出区。那些在抽吸区域是可能的后果,在图中可见的流量波动4-19 ,这表明,在抽吸过程中的流动和在最开始的压缩还没有这样衰减。另一方面,压阻式传感器用于测量压力进行在较低的压力更高的错误确保接近零在这些领域的差异,这是。记录的差异在高压端,在放电过程中,可能产生的被导致的无法捕捉真正geometryaccurately的。计算出的放电端口简化了从真实的。它也映射到具有相对低的细胞数。的计算精度上的网目尺寸的影响是分析在第4.3.5节中更详细地说明。英文原文The male and female rotors have 40 numerical cells along each interlobe in the circumferential direction, 6 cells in the radial direction and 112 in the axial direction. These form a total number of 444,830 cells for both rotors and the housing.To avoid the need to increase the number of grid points, if a more precise calculation is required, an adaptation method has been applied to the boundary definition.The number of time changes was 25 for one interlobe cycle in this case. The total number of time steps needed for one full rotation of the male rotor is then 125. The number of cells in the rotors was kept the same for each time step. To achieve this, a special grid moving procedure was developed in which the time step was determined by the compressor speed, as explained in Chapter 4. The numerical grid for the initial time step is presented in Figure 4-15.Figure 4-15 Numerical grid for oil injected screw compressor with 444,830 cells4.3.2 Mathematical Model for an Oil-Flooded Compressor The mathematical model consists of the momentum, energy, mass and space equations, described in section 2.2, but an additional equation for the scalar property of oil concentration was added to enable the influence of oil on the entire com-pressor performance to be calculated.The constitutive relations are the same as in the previous example. The oil is treated in the model as a passiveapryspecies, which does not mix with the background fluid - air. Its influence on the air is accounted arefor through the energy and mass sources which are added to or subtracted from the appropriate equation of the main flow model. In this case, the momentum equation is affected by drag forces as described earlier. To establish the full range of working conditions and starting from a suction pressure of 1 bar to obtain an increase in pressure of 6, 7, 8 and 9 bars at dis-charge, a numerical mesh of nearly d450,000 cells was used. For each case only 25 time steps were required to obtain the required working conditions, followed by a further 25 time steps to complete a full compressor cycle. Each time step needed about 30 minutes running time on an 800 MHz AMD Athlon processor. The computer memory required was about 450 MB.4.3.3 Comparison of the Numerical and Experimental results for an Oil-Flooded CompressoIn the absence of velocity field measurements in the compressor chamber, an experimentally obtained pressure history within the compressor cycle and the measured air flow and compressor power served as a valuable basis to validate the results of the CFD calculation. To obtain these values, the 5/6 oil flooded compressor, already described, was tested on a rig installed in the compressor labo-ratory at City University London, Figure 4-16.Figure 4-16 Oil-Injected air screw compressor 5/6-128mm (a=90mm) in the test bedThe test rig meets all Pneurop/Cagi requirements for screw compressor acceptance tests. The compressor was tested according to ISO 1706 and its delivery flow wasmeasured following BS 5600. The pressures were measured with high quality pressure transducers, with readings taken at the inlet to the compressor, discharge from the compressor andin the separator. The temperatures were measured by FeCo thermocouples at the inlet to and discharge from the compressor and after the oil separator. Measurements of temperature were also taken of both, the oil and the cooling water at the inlet end of the oil cooler. The oil flow rate was calculated from the cooler and compressor energy and mass balances.Torque was measured by a laboratory type torque meter transducer IML TRP500 connected between the engine and the compressor driving shaft. The compressor was driven by a diesel engine prime mover of 100 kW maximum output,which could operate at variable speed. The compressor speed was measured by a frequency meter and the signal was transferred to a data logger after converting to current.Figure 4-17 Computer screen of compressor test rig measuring programThe compressor flow was measured by an orifice plate according to BS 5600 with the differential pressure measured by a pressure transducer PDCR 120/35WL over an operating range of 0-200 kPa.The measured values of all relevant pulsating quantities were used to obtain details of the thermodynamic cycle. Of these, the pressure in the trapped volume was the most significant since it was required to plot the machine p-V diagram. Accordingly, a method was developed to construct an entire p-V diagram from the recording of pressure changes at only 4 discrete points in the machine casing.Endevco piezoresistive transducers E8180B were used to measure the instan-taneous values of the absolute pressure in the compressor. Each transducer re-corded the pressure in one interlobe space. Starting from the suction end, 4 transducers were positioned in the compressor casing to record the changes in each consecutive interlobe space. When plotted in sequence they gave a pressure-time diagram for the whole compressor working cycle.Figure 4-18 Velocity vectors in the two compressor cross sectionsTop cross section A-A through the suction port, Bottom cross section B-B All measured values were automatically logged and transferred to a PC through a high-speed InstruNet data logger. The data acquisition system enabled high speed measurements to be made at frequencies of more then 2 kHz. An acquisition and measuring program for the PC was written for this in Visual Basic that permitted online measurement and calculation of the compressor working parameters. A computer screen record of this measuring program is given in Figure 4-17. In Figure 4-18 the velocity vectors in two cross sections are presented. One of these is through the inlet port and oil injection pipe and the other is close to dis-charge. Figure 4-19 shows the both locities in the vertical section through the com-pressor. High velocity values in the gaps, both between the rotors and their hous-ing and between the two rotors, are generated by the sharp pressure gradients through the clearances. These are clearly distinguished from the velocities in the interlobe regions where the fluid flows relatively slowly. The fluid flow is caused there only by movement of the numerical mesh, which is generated in a manner to follow the movement of the rotors in time. The top diagram shows the cross section through both the suction port and oil injection openings. Recirculation in the suction port is substantial and seems to be high because of the position of the oil injection hole. If the oil injection had been positioned further downstream, the recirculation would have been reduced. The bottom diagram, which shows a cross section close to the discharge port, indicates that more recirculation is present in the lobes with lower pressures, as is visible in the top of the diagram. The velocities in the high pressure regions are smoothed to relatively low values, to some ex-tent similar to the wall velocities. The velocity field in the axial section C-C, which crosses both rotors along therotor bore cusp, is shown in Figure 4-19.Figure 4-19 Velocity vectors in the compressor axial section C-CSmoothing of the velocities is visible in the high pressure regions at the right end of the figure. In the upper portions of the compressor, where both, low pressures and low pressure gradients occur, flow patterns are more curved, thus indicating flow swirls. There is also recirculation in the far end of the suction port while, at the same time, the flow through the axial part of the port is more intensive.The oil distribution and pressure field in the cross section A-A are shown on the top and bottom diagrams of Figure 4-20 respectively. As noted earlier, some fluid recirculates from the working chamber to the suction port through the compressor clearances. Figure 4-20 indicates that together with air, the oil escapes from the pressurised working chamber to the suction port through the rotor-to-rotor leakage paths. The presence of oil in the suction port was also observed visually during tests on this compressor. However, no measurements were made of it.Figure 4-20 Cross section through the inlet port and oil injection port A-ATop mass concentration of oil, Bottom - Pressure distributionSome limited results of an experimental investigation on oil distribution within a screw compressor are published by Xing et al (2001). In that case, the oil flow was observed by making the compressor casing from a transparent material. Although the authors do not have a complete record of their results, it appears from what they published that the oil flow patterns obtained from the 3-D calculations are similar to those obtained in their experiments. The presence of hot oil in the suction port, although beneficial for the lubrication of the rotors, increases the gas temperature before the working chamber is closed. This reduces the trapped mass and hence the compressor capacity and is another of the effects which are not modelled by one-dimensional models of screw compressor processes. Figure 4-21 shows the pressure distribution within the compressor with a male rotor speed of 5000 rpm. This figure indicates that the pressure within the each working chamber is almost uniform and that it can be regarded as such for almost all calculations and comparisons. Due to that, the results obtained from the 3-D calculations may be compared with those obtained from measurements.Figure 4
温馨提示:
1: 本站所有资源如无特殊说明,都需要本地电脑安装OFFICE2007和PDF阅读器。图纸软件为CAD,CAXA,PROE,UG,SolidWorks等.压缩文件请下载最新的WinRAR软件解压。
2: 本站的文档不包含任何第三方提供的附件图纸等,如果需要附件,请联系上传者。文件的所有权益归上传用户所有。
3.本站RAR压缩包中若带图纸,网页内容里面会有图纸预览,若没有图纸预览就没有图纸。
4. 未经权益所有人同意不得将文件中的内容挪作商业或盈利用途。
5. 人人文库网仅提供信息存储空间,仅对用户上传内容的表现方式做保护处理,对用户上传分享的文档内容本身不做任何修改或编辑,并不能对任何下载内容负责。
6. 下载文件中如有侵权或不适当内容,请与我们联系,我们立即纠正。
7. 本站不保证下载资源的准确性、安全性和完整性, 同时也不承担用户因使用这些下载资源对自己和他人造成任何形式的伤害或损失。
提示  人人文库网所有资源均是用户自行上传分享,仅供网友学习交流,未经上传用户书面授权,请勿作他用。
关于本文
本文标题:围板包装箱自动化生产线铆接装置的设计【优秀】【带UG三维】【word+8张CAD图纸】【毕设】
链接地址:https://www.renrendoc.com/p-313635.html

官方联系方式

2:不支持迅雷下载,请使用浏览器下载   
3:不支持QQ浏览器下载,请用其他浏览器   
4:下载后的文档和图纸-无水印   
5:文档经过压缩,下载后原文更清晰   
关于我们 - 网站声明 - 网站地图 - 资源地图 - 友情链接 - 网站客服 - 联系我们

网站客服QQ:2881952447     

copyright@ 2020-2025  renrendoc.com 人人文库版权所有   联系电话:400-852-1180

备案号:蜀ICP备2022000484号-2       经营许可证: 川B2-20220663       公网安备川公网安备: 51019002004831号

本站为文档C2C交易模式,即用户上传的文档直接被用户下载,本站只是中间服务平台,本站所有文档下载所得的收益归上传人(含作者)所有。人人文库网仅提供信息存储空间,仅对用户上传内容的表现方式做保护处理,对上载内容本身不做任何修改或编辑。若文档所含内容侵犯了您的版权或隐私,请立即通知人人文库网,我们立即给予删除!