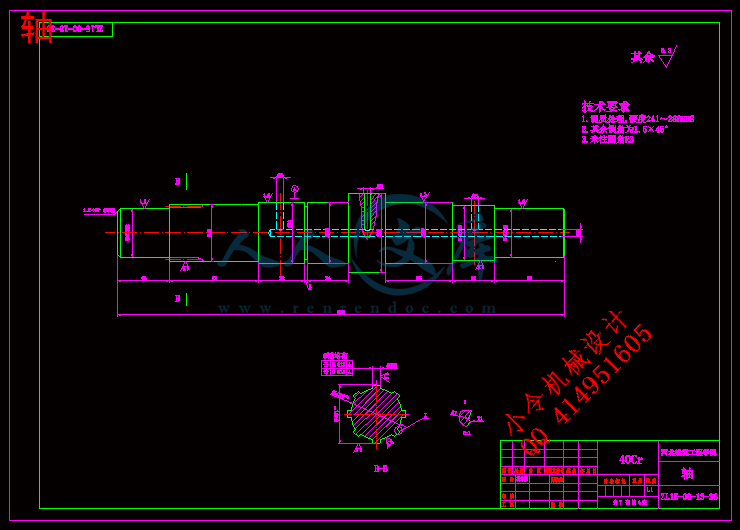
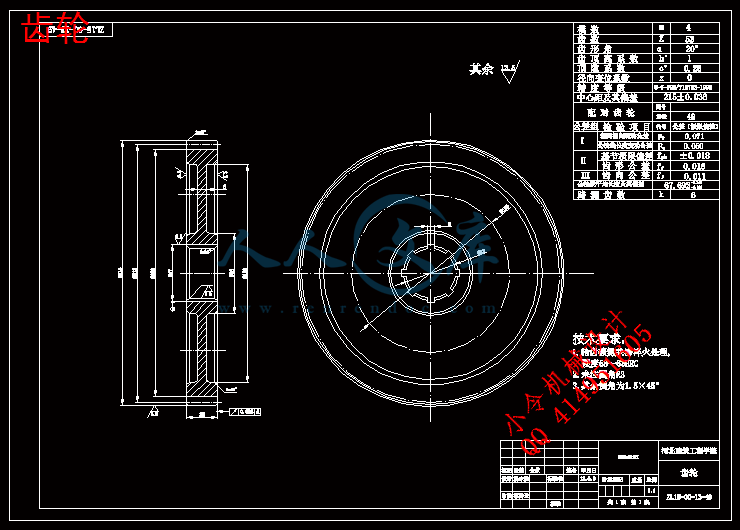
齿轮.dwg
齿轮.dwg

ZL15装载机总体及变速箱设计任务书(3轴及齿轮)【全套CAD图纸+WORD毕业论文】【工程机械】

收藏

压缩包内文档预览:
预览图
编号:395877    类型:共享资源    大小:19.33MB    格式:RAR    上传时间:2015-01-15 上传人:好资料QQ****51605 IP属地:江苏
45
积分
关 键 词:
zl15 装载 总体 整体 变速箱 设计 任务书 齿轮 全套 cad 图纸 word 毕业论文 工程机械
资源描述:

【温馨提示】 购买原稿文件请充值后自助下载。

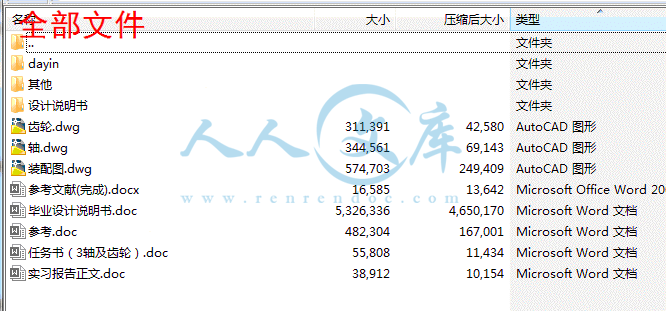
[全部文件] 那张截图中的文件为本资料所有内容,下载后即可获得。


预览截图请勿抄袭,原稿文件完整清晰,无水印,可编辑。

有疑问可以咨询QQ:414951605或1304139763

目录
摘   要......................................................................................................................I
Abstract.............................................................................................................II
第一章  绪  论...................................................................................................... 1
1.1 装载机简介 1
1.2 设计内容 1
1.3 装载机发展概况 2
第二章  装载机总体设计.......................................................................................3
2.1 装载机总体参数的确定 3
2.2  装载机的插入阻力与掘起阻力的确定 4
第三章  装载机工作装设置计...............................................................................6
3.1  工作装置的设计要求 6
3.1.1概述 6
3.1.2轮式装载机工作过程 7
3.1.3 轮式装载机工作装置设计要求 7
3.2  铲斗设计 8
3.2.1铲斗的结构形式 8
3.2.2铲斗的分类 9
3.2.3铲斗的设计要求 9
3.2.4铲斗设计 9
3.3  动臂设计 14
3.3.1对动臂的设计要求 14
3.3.2 动臂铰点位置的确定 14
3.3.3动臂长度的确定 16
3.3.4动臂结构和形状的确定 17
3.4  连杆机构的设计 18
3.4.1工作装置连杆机构的类型 18
3.4.2连杆机构的设计要求 20
3.4.3连杆机构尺寸参数设计及铰点位置确定 21
第四章  工作装置受力分析及强度计算.............................................................26
4.1  确定计算位置及典型工况 26
4.1.1计算位置的确定 26
4.1.2典型工况选取和外载荷的计算 26
4.2  工作装置受力分析 27
4.2.1对称载荷工况 27
4.2.2偏载工况 30
4.3  工作装置强度校核 31
4.3.1动臂 31
4.3.2铰销强度的校核 32
第五章  工作装置的建模及仿真分析.................................................................34
5.1 工作装置建模 34
5.1.1在Pro/E中建立铲斗 34
5.1.2启动ADAMS/View 程序 35
5.1.2检查和设置建模基本环境 35
5.1.3 Pro/E铲斗模型导入ADAMS 35
5.1.4工作装置的几何建模 36
5.1.5 创建约束及施加运动和载荷 38
5.2初步仿真分析该模型的性能参数 41
5.2.1铲斗后倾角及卸载角的测量 41
5.2.2分析…………………………………………………………………………………....43
第六章  结   论...................................................................................................44
参 考 文 献...........................................................................................................45
致      谢.............................................................................................................46

摘   要
装载机是一种用途较广的铲运、施工机械。它广泛用于公路、铁路、建筑、水电、港口和矿山等工程建设。装载机具有作业速度快、效率高、机动性好、操作轻便等优点,是现代机械化施工中不可缺少的装备之一。
ADAMS是一款虚拟样机技术软件,其强大的机械系统动态仿真技术大大简化了机械产品的设计过程,缩短了产品开发的周期和成本,明显提高了产品质量。应用ADAMS软件设计装载机,首先是虚拟样机模型的建模,然后是样机仿真,在本设计中,我们对工作装置设计计算和虚拟样机建模,使用ADAMS对其进行模拟仿真控制,而其工作装置用ProE进行了建模,可以根据设计者要求来进行调整,从而方便了设计者的不同需求。

关键词: 装载机;工作装置;ADAMS;仿真


Abstract
Loader is a broader use of scraper, construction machinery. It widely used in highway, railway, construction, utilities, ports and mines, and other construction projects. Loader is operating speed, high efficiency, good mobility, the advantages of operating the Light, lower costs of the project has played an important role in the construction of a modern mechanized equipment indispensable one.
ADAMS as a virtual prototyping software, its powerful dynamic mechanical system simulation technology greatly simplifies the mechanical product design process and shorten the product The development cycle and cost, significantly improved product quality. ADAMS application software design loaders, is the first virtual prototype model of modeling, simulation and prototype is in the design, We design and calculation of the working device and the virtual prototype modeling, the use of its ADAMS simulation control, and their work devices ProE a standard model, designers can adjust to demand, thus facilitating the different needs of the designers.

Keywords:  Loader;  Work-Equipment;  ADAMS;  Simulation

第一章  绪  论
1.1 装载机简介
装载机属于铲土运输机械类,是一种通过安装在前端一个完整的铲斗支承结构和连杆,随机器向前运动进行装载或挖掘,以及提升、运输和卸载的自行式履带或轮胎机械。它广泛用于公路、铁路、建筑、水电、港口和矿山等工程建设。装载机具有作业速度快、效率高、机动性好、操作轻便等优点,因此成为工程建设中土石方施工的主要机种之一,对于加快工程建设速度,减轻劳动强度,提高工程质量,降低工程成本都发挥着重要的作用,是现代机械化施工中不可缺少的装备之一。近年来,装载机的品种和产量在国内外都得到了迅猛的发展。此次的设计任务就是装载机的重要组成部分——工作装置。
图1-1  轮式装载机结构示意图
1—柴油发动机;2—液力变矩器;3—变速箱;4—前、后桥;5—车架铰链;
6—动臂提升油缸;7—转斗油缸;8—铲斗;9—驾驶室;11—滤清器
1.2 设计内容
ZL_50轮式装载机工作装置建模及仿真;工作装置选型设计;工作装置模型的建立;工作装置仿真分析是本次设计的主要内容。这次设计应用到虚拟样机技术软件ADAMS、PRO/E软件的建模。
设计时利用ADAMS、PRO/E等软件对轮式装载机工作装置进行设计和分析,可以快捷、高效、精确地解决许多设计上的难题,使设计的工作量减少,设计工作得到简化,设计效
内容简介:
河北建筑工程学院毕业设计(论文)外文资料翻译 系别: 机械工程系 专业: 机械设计制造及其自动化 班级: 机094 姓名: 杨东胜 学号: 2009307413 外文出处: /locate/jterra (用外文写)附 件:1、外文原文;2、外文资料翻译译文。指导教师评语:签字: 年 月 日1、 外文原文(复印件)2、外文资料翻译译文译文标题(3号黑体,居中) (小4号宋体,1.5倍行距)。(要求不少于3000汉字)The numerical modelling of excavator bucket filling using DEMC.J. Coetzee*, D.N.J. ElsDepartment of Mechanical and Mechatronic Engineering, University of Stellenbosch, Private Bag X1, Matieland 7602, South AfricaReceived 15 February 2007; received in revised form 25 February 2009; accepted 28 May 2009Available online 25 June 2009AbstractThe filling of an excavator bucket is a complex granular flow problem. In order to optimize the filling process, it is important to under-stand the different mechanisms involved. The discrete element method (DEM) is a promising approach to model soil-implement inter-actions and it was used in this study to model the filling process of an excavator bucket. Model validation was based on the accuracy withwhich the model predicted the bucket drag force and the development of the different flow regions. Compared to experimental measure-ments, DEM predicted lower bucket drag forces, but the general trend was accurately modelled. At the end of the filling process the errorin predicted drag force was 20%. Qualitatively, there was a good agreement between the observed and the modelled flow regions in termsof position and transition from one stage to the other. During all stages of filling, DEM was able to predict the volume of material insidethe bucket accurately to within 6%.? 2009 ISTVS. Published by Elsevier Ltd. All rights reserved.1. IntroductionEarthmoving equipment plays an important role in theagricultural, earthmoving and mining industries. Theequipment is highly diverse in shape and function, but mostof the soil cutting machines can be categorised into one ofthree principal classes, namely blades, rippers and buckets(shovels). This paper focuses on the numerical modelling ofexcavator bucket filling using the discrete element method(DEM).Buckets are found on a number of earthmoving machin-ery. Draglines are used to remove blasted overburden fromopen cut mines. Its removal exposes the coal depositsbeneath for mining. A dragline is a crane-like structurewith a huge bucket of up to 100 m3in volume suspendedby steel ropes. Draglines are an expensive and essential partof mine operations and play an important role in the com-petitiveness of South African mines. In the coal miningindustry it is generally accepted that a 1% improvementin the efficiency of a dragline will result in an R1 millionincrease in annual production per dragline 1. Bucketsare also found on hydraulic excavators, loaders and shovelexcavators.The filling of a bucket is a complex granular flow prob-lem. Instrumentation of field equipment for measuringbucket filling is difficult and expensive. It is possible touse small-scale (usually 1/10th scale) experimental rigs toevaluate bucket designs 1,2 but they are expensive andthere are questions regarding the validity of scaling 3,4.To scale-up results from model experiments is problematicsince there are no general scaling laws for granular flows asthere are for fluid dynamics 5.According to Cleary 5 the filling of buckets, in theabsence of very large rocks, is observed to be relativelytwo-dimensional with little motion in the transverse direc-tion. The flow pattern along a cross-section of the bucket inthe drag direction is the most important aspect of fillingand can be analysed satisfactorily using two-dimensionalmodels. Rowlands 2 made similar observations based ondragline bucket filling experiments.According to Maciejewski et al. 6, in practical caseswhen the motion of a bucket or bulldozer blade is dis-cussed, plane strain conditions apply only in some defor-mation regions. The plane strain solution for such toolscan be assumed only with limited accuracy. Maciejewski0022-4898/$36.00 ? 2009 ISTVS. Published by Elsevier Ltd. All rights reserved.doi:10.1016/j.jterra.2009.05.003*Corresponding author. Tel.: +27 21 808 4239; fax: +27 21 808 4958.E-mail address: ccoetzeesun.ac.za (C.J. Coetzee)./locate/jterraAvailable online at Journal of Terramechanics 46 (2009) 217227JournalofTerramechanicset al. 6 also investigated the assumption of plane strainconditions in soil bins where the soil and tool motion isconstrained between two transparent walls. For measure-ments in such a bin, the force acting on the tool due tothe friction between the soil and the sidewalls has to be esti-mated or neglected. They have shown that for a high num-ber of teeth on the bucket, the teeth do not act as separatethree-dimensional objects but as one wide tool built upfrom several modules. The deformation pattern in frontof such an assembly of teeth was found to be plane straindeformation. The authors, however, concluded that thiswas true for the particular cohesive soil (sandy clay) andmay not apply to other (especially rocky and brittle) mate-rials. In this study the bucket had a full-width lip with noteeth and based on the findings by Maciejewski et al. 6,the assumption of plane strain was made and two-dimen-sional DEM models were used.Analytical methods 711 used to model soiltool inter-action are limited to infinitesimal motion of the tool andthe given geometry of the problem. These methods werenot expected to be valid for the analysis of the subsequentstages of advanced earth digging problems 12. The analyt-ical methods are based on Terzaghis passive earth pressuretheory and assumptions of a preliminary soil failure pattern13. Complicated tool geometry (such as buckets) and largedeformations cannot be modelled using these methods 14.The discrete element method is a promising approach tomodel soil-implement interaction and can be used to over-come some of the difficulties encountered by analyticalmethods 15. In DEM, the failure patterns and materialdeformation are not needed in advance. The tools are mod-elled using a number of flat walls and the complexity of thetool geometry does not complicate the DEM model. Largedeformation in the granular material and the developmentof the granular material free surface are automatically han-dled by the method.Cleary 5 modelled dragline bucket filling using DEM.Trends were shown and qualitative comparisons made, butno experimental results were presented. The process ofhydraulic excavator bucket filling was investigated experi-mentally by Maciejewski and Jarzebowski 12. The aim oftheir research was optimization of the digging process andbucket trajectories. It is shown that the most energy efficientbucket is the one where the pushing effect of the back wall isminimized.Owenetal.21modelled3Ddraglinebucketfill-ing. In there approach, the bucket was modelled with thefinite element method and the soil with DEM. Ellipsoidsand clumped spheres were used to approximate the particleangularity. The bucket followed a prescribed path.Esterhuyse 1 and Rowlands 2 investigated the fillingbehaviour of scaled dragline buckets experimentally withthe focus on rigging configuration, bucket shape and teethspacing. They have shown that the aspect ratio of thebucket (width to depth) plays and important role in thedrag distance needed to fill a bucket. The bucket with theshortest fill distance was found to produce the highest peakdrag force.The main objective of this study was to demonstrate theability of DEM to predict the drag force on the bucket andthe material flow patterns that develop as the bucket fillsup. The DEM results were compared to experiments per-formed in a soil bin.2. The discrete element methodDiscrete element methods are based on the simulation ofthe motion of granular material as separate particles. DEMwas first applied to rock mechanics by Cundall and Strack16. In this study, all the simulations were two-dimensionalandperformedusingcommercialDEMsoftwarePFC2D17.A linear contact model was used with a spring stiffness knin the normal direction and a spring stiffness ksin the sheardirection (Fig. 1). Frictional slip is allowed in the tangentialdirectionwithafrictioncoefficientl.Thedampingforceactson a particle in the opposite direction to the particle velocityand is proportional to the resultant force acting on the par-ticle with a proportionality constant (damping coefficient)C 17. For a detailed description of DEM, the reader isreferred to Cleary and Sawley 18, Cundall and Strack16, Hogue 19 and Zhang and Whiten 20.3. ExperimentalTwo parallel glass panels were fixed 200 mm apart toform the soil bin. The bucket profile was fixed to a trolleywhich was driven by a ball screw and stepper motor. TheFrictionknksFig. 1. DEM contact model.218C.J. Coetzee, D.N.J. Els/Journal of Terramechanics 46 (2009) 217227complete rig could be set at an angle h to the horizontal asshown in Fig. 2a. The first arm was then rotated and fixedsuch that both arms remained vertical. The second armremained free to move in the vertical direction. First, coun-terweights were added at position A (Fig. 2a) to balancethe combined weight of the bucket profile and the secondarm assembly. This resulted in a weightless” bucket.Counterweights were then added at position B to set theeffective” bucket weight. Since arm 2 was always verticaleven for rig angles other then zero, the effective bucketweight always acted vertically downwards (Fig. 2c). Bucketweights of 49.1 N, 93.2 N, 138.3 N and 202.1 N were used.When the bucket was dragged in the direction as indi-cated, it was also free to move in the vertical direction asa result of the effective bucket weight and the force of thegrains acting on it. The bottom edge of the bucket wasalways set to be parallel to the drag direction and the mate-rial free surface. This type of motion resembles that of adragline bucket which is dragged in the drag direction bya set of ropes, but with freedom of motion in all otherdirections 2.Spring loaded Teflon wipers were used to seal the smallopening between the bucket profile and the glass panels. Aforce transducer was designed and built to measure the dragforce on the bucket. A set of strain gauges was bonded to asteel beam of which the position is shown in Fig. 2a. Theset of four strain gauges was used to measure the force inthe drag direction. Other force components were notmeasured. The force transducer was calibrated and thecalibration checked regularly to avoid drift in the measure-ments. For rig angles other than zero, the force transducerwas zeroed before the drag commenced. This compensatedforthecomponentofthebucketweightthatactedinthedragdirection. The vertical displacement of the bucket was mea-sured with a linear variable differential transformer (LVDT)andusedasinputtotheDEMsimulation. Inboththeexper-imentsandtheDEMsimulationsthebucketwasgivenadragvelocity of 10 mm s?1. The dimensions of the bucket profileare shown in Fig. 2b.In this study corn grains were used. Although the corngrains are not real soil, Rowlands 2 observed that seedgrains are suitable for experimental testing and closelyresemble natural soil flow into dragline buckets.4. DEM parameters and numerical modelFig. 3 shows the range of measured grain dimensionsand the equivalent DEM grain. A normal distributionwithin the range of dimensions given was used to createthe clumped particles. Clumps can be formed by addingtwo or more particles (discs in 2D and spheres in 3D)together to form one rigid particle, i.e. particles includedin the clump remain at a fixed distance from each other17. Particles within a clump can overlap to any extentand contact forces are not generated between these parti-cles. Clumps cannot break up during simulations regardlessof the forces acting upon them. In the model 20,00030,000clumped particles were used.A calibration process, presented in another paper, wasdeveloped for cohesionless material. The particle size, shapeand density were determined from physical measurements.The laboratory shear tests and compressions tests were usedto determine the material internalfriction angleandstiffnessrespectively. These tests were repeated numerically usingDEM models with different sets of particle friction coeffi-cientsandparticle stiffness values.Thecombinationofsheartestandcompressiontestresultscouldbeusedtodetermineaunique set of particle friction and particle stiffness values,Table 1.ADirection of drag Direction of vertical motion 2nd Arm1st ArmBForce transducer 100 mm200 mm150 mm Max volume 35 mm45WbcosWbCounter weights abcFig. 2. Experimental setup.5 - 98 - 125 - 64 - 53 - 6R 2.5 - 4.5 R 1.5 - 3.0 3.0 - 5.0 abFig. 3. (a) Physical grain dimensions and (b) DEM grain model.Dimensions in (mm).C.J. Coetzee, D.N.J. Els/Journal of Terramechanics 46 (2009) 217227219In the software used, PFC2D, so-called walls are used tobuild structures. The test rig and the bucket, with the samedimensions as in the experiment, were built from walls. Thewalls are rigid and move according to prescribed transla-tional and rotational velocities. The forces and momentsacting on the walls do not influence the motion of the wall.During the experiments a constant drag velocity of10 mm s?1was applied while the vertical displacementwas measured. The vertical displacement was influencedby both the rig angle and the effective bucket weight. A typ-ical result is shown in Fig. 4. Except for the initial transi-tion, the vertical velocity was nearly constant, for a givensetup, and increased with an increase in bucket weight. Inthe DEM model, the drag velocity was set to 10 mm s?1and the measured vertical displacement was read from adata file and applied to the bucket.Standard functions build into PFC2Dwere used toobtain the forces and moments acting on individual wallsand on the bucket as a whole. For rig angles other thanzero, the rig was kept horizontal but the gravity compo-nents were set accordingly.5. Results and discussionIt is difficult to make quantitative comparisons regard-ing flow patterns. When comparing the material freesurface, some comparisons could however be made. Figs.5 and 6 show how the material flowed into the bucket forrig angles of h = 0? and h = 20?, respectively. When com-paring the shape of the material free surface, the simula-tions were able to predict the general shape during theinitial stages of filling. The simulations however failed toaccurately predict the material free surface during the finalstages of filling.Curves were fitted to the experimental free surface andoverlaid on the numerical results in Figs. 5 and 6. The max-imum difference between the two free surfaces (heapheight) was measured along the direction perpendicularto the drag direction. Two measurements were made, onewhere DEM predicted a higher heap height, and onemeasurement where DEM predicted a lower heap height.The values and the positions where they were measuredare indicated in the figures. Taking the nominal particlesize as 10 mm, DEM predicted the heap height accuratelywithin 1.54.5 particle diameters.Fig. 7 shows typical drag forces obtained from experi-ments and simulations. The large jump in the drag forceat the beginning of the experiment was observed in mostof the runs and could not be explained and needs furtherinvestigation. From this result, it is clear that the DEMmodel captured the general trend in drag force, but it pre-dicted lower values compared to the measured values. Overthe complete drag of 800 mm, the model predicted a forcewhich was 1550 N lower than the measured force. At theend of the drag the error was 20%. The frictional forcebetween the Teflon wipers and the glass panels was mea-sured in a run without grains. This frictional force was sub-tracted from the measured drag force. Frictional forcesbetween the grains and the side panels would also havean influence on the measured results. These frictional forcescould not be measured or included in the 2D DEM modeland might be the reason why the model predicts lower dragforces 6.The drag energy was defined as the area under the dragforcedisplacement curve. Making use of different rigangles h and effective bucket weights Wb, the drag energyE700up to a displacement of 700 mm is compared in Fig. 8.The first observation that could me made was that withan increase in effective bucket weight, for a given rig angleh, there was a linear increase in required drag energy. Acloser investigation showed that with an increase in bucketweight, the bucket was forced deeper into the materialwhich caused a higher drag force when compared to abucket with less weight.The second observation that can be made is that with anincrease in the rig angle, there is a decrease in drag energy.The effective bucket weight Wbalways acted verticallyTable 1Summary of corn properties and DEM parameters used.Macro propertyMeasuredDEMInternal friction angle23?24?Angle of repose25 2?24 1?Bulk density778 kg m?3778 kg m?3Confined bulk modulus1.60 MPa1.52 MPaMaterial-steel friction14?14?Calibrated DEM propertiesParticle stiffness, kn= ks450 kN/mParticle density, qp855 kg/m3Particle friction coefficient, l0.12Other propertiesDamping, C0.2Model width0.2 m0100200300400500Drag displacement mm60070020406080100Vertical displacement mm120Wb= 202.1 N138.3 N93.2 N 49.1 N Fig. 4. Measured vertical displacement of the bucket with h = 10? andfour values of effective bucket weight Wb.220C.J. Coetzee, D.N.J. Els/Journal of Terramechanics 46 (2009) 217227downward (Fig. 2c) so that the normal force pushing thebucket into the material is given by Wb? cos (h). Thus, withan increase in rig angle, there is a decrease in the normalforce pushing the bucket into the material. This caused areduction in the drag force, and hence a reduction in thedrag energy, when compared to results using a lower rigangle. The DEM simulations were able to capture the gen-eral trends, but it predicted drag energies lower than themeasured. The reason for this is that the predicted dragforces were too low due to the exclusion of the frictionforces between the grains and the glass panels. It would,however, still be possible to use the simulation results forqualitative optimization of bucket filling.Using the simulation results it was possible to identifyhow much of the total force was exerted on each of thebucket sections. In Fig. 9 the bucket was divided into sixsections. The graphs show, as a ratio of the total dragforce, the force on each of the sections. From the startup to a displacement of 200 mm (25% of total displace-ment) the total force acted mainly on the lip and the bot-tom section. As material started to flow into the bucket,the other sections came into play, first the inner curveand finally the front section. Less than 5% of the forceacted on the top section. This was far less than the bottomsection (30%). The reason for this is that the material insidethe bucket showed little movement relative to the bucketFig. 5. Bucket filling results with rig angle h = 0?.C.J. Coetzee, D.N.J. Els/Journal of Terramechanics 46 (2009) 217227221and the pressure on the top section was only due to theweight of the material inside the bucket. On the bottomsection, the pressure was due to the combined weight ofthe material inside the bucket and the weight of the bucketitself. During the complete filling process, 2030% of thedrag force acted on the lip. This shows that the design ofthe lip and teeth is important. It is well known that thelength of the lip/teeth and the angle of attack are importantfactors influencing bucket filling 2 .Rowlands 2 made use of mixtures of millet, peas andcorn in his 2D test rig. The observation of the filling behav-iour led to the development of a theory that describes theflow characteristics and patterns of material entering thebucket. Rowlands 2 named this concept the Shear ZoneTheory. He observed that definite planes of shear (rupture)formed between distinct moving material regimes. Theseshear planes changed orientation and location dependingon initial setup and during different stages of the filling pro-cess itself. The generalised theory is shown in Fig. 10. Thedifferent flow regions, as named by Rowlands 2, are indi-cated on the figure. The movements of the material relativeto the bucket are indicated by the arrows.The virgin material remains largely undisturbed until thefinal third of the drag during which bulldozing” occurs.The initial laminar layer flows into the bucket during thefirst third of the drag (Fig. 10a). After entering to a certaindistance, this layer fails at the bucket lip and subsequentlybecomes stationary with respect to the bucket for theFig. 6. Bucket filling results with rig angle h = 20?.222C.J. Coetzee, D.N.J. Els/Journal of Terramechanics 46 (2009) 217227remainder of the drag (Fig. 10b and c). At steeper dragangles, the material flows more rapidly towards the rearbecause of the added gravitational assistance. This effectcan be seen by comparing Figs. 5 and 6.With the laminar layer becoming stationary, a new zone,the active flow zone, develops (Fig. 10). In this zone, thematerial displacement is predominantly in the verticaldirection. The active dig zone is located above the teethand bucket lip. This area develops as material starts toenter the bucket and increases in size after failure of the ini-tial laminar layer. In this zone, the virgin material fails andeither flows into the bucket as part of the laminar layerduring the first part of filling or moves into the active flowzone during the latter part of filling.The dead load that has resulted from live” material inthe active flow zone ramps up and over the initial laminarlayer. Some of the material in the initial laminar layer failsand starts to form part of the dead load (Fig. 10c). Duringexperiments and while the material was flowing, a definiterupture or shear line could be observed here. With anincrease in drag angle, the active dig zone and active flowzone tended to join into one continuous band.1002003004005006007008000ExperimentSimulation250200Drag force N 15010050Displacement in drag direction mm Fig. 7. Typical bucket drag forces with rig angle h = 10? and a bucketweight Wb= 138.3 N. = 0 = 10 = 20 Experiment Simulation 40 40220200 180160140120WbN 10080 60 506070 80100 120 110 90E700 J Fig. 8. Bucket drag energy E700as a function of the bucket weight Wbfordifferent rig angles h.010020030040050060070080000.10.20.30.40.5Displacement mm Drag force ratio FrontInner curveTopLip Bottom Outer curve LipTopBottomFrontInner curveOuter curveFig. 9. Bucket drag force distribution with h = 10?.Active dig zone Initial laminar layer Active dig zone Initial laminar layerActive flow zone Virgin material Active dig zone Dead loadActive flow zone Initial laminar layer Shear lineShear line Shear line Dead load shear line Virgin material Virgin material bcaFig. 10. The Shear Zone Theory according to Rowlands 2.C.J. Coetzee, D.N.J. Els/Journal of Terramechanics 46 (2009) 217227223It should be noted that Fig. 10 only shows three stagesof the filling process, but in reality there is a gradual tran-sition from one stage to the next. It should also be notedthat this is a generalised theory and there will be variationsin the results when different materials and bucket geome-tries are used. During experiments two definite shear linescould be observed. The one extended from the tip of thelip up to the free surface. This is named the cutting shearline. The second line is the one between the initial laminarlayer and the dead load, called the dead load shear line.Making use of DEM and investigating the flow regionsfurther, the following procedure was devised. The bucketwas moved through the material and paused” after each100 mm. The displacement vector of each particle was thenset to be zero after which the bucket was given a furtherdisplacement of 1015 mm (13 particle lengths). The par-ticle displacement ratio PDR was defined as the ratio of themagnitude of the particle absolute displacement vector tothe magnitude of the bucket absolute displacement vector.The particles were then coloured according to their individ-ual PDR values. A PDR equal to unity means that the par-ticle is moving with the bucket. The result is shown inFig. 11. This is in effect the average velocity ratio over ashort period.The flow regimes as predicted by the Shear Zone Theoryare indicated on the figure. The three pictures correspondFig. 11. Flow regions using the particlebucket displacement ratio.224C.J. Coetzee, D.N.J. Els/Journal of Terramechanics 46 (2009) 217227to the three pictures given in Fig. 10. After a displacementof 100 mm, the active dig zone is clearly visible with0.40 6 PDR 0.65. The initial laminar layer moves intothe bucket with 0.10 6 PDR 0.25. This corresponds wellto the flow zones shown in Fig. 10a.After 500 mm, the characteristic V” shape of the activeflow zone can be seen with 0.10 6 PDR 0.25. Althoughthe PDR is relatively low, the displacement is predomi-nantly in the vertical direction. The active dig zone is stillpresent and in the back of the bucket, the initial laminarlayer starts to become stationary relative to the bucket.This is visible by the PDR values that increase towardsthe back of the bucket. This corresponds well to the flowzones shown in Fig. 10b.After 800 mm the existence of the dead load shear line isclearly visible. When compared to Fig. 10c, the active flowzone and active dig zone cannot be distinguished from thedead load. The reason for this is that at a bucket displace-ment of 800 mm, the bulldozing effect is large and over-shadows the other flow zones.Dragline bucket optimization is very important in termsof force and energy requirements and cycle time. In someapplications it would be advantageous to fill the bucketusing the minimum amount of energy. In other applica-tions, it would be advantageous to fill the bucket as quicklyas possible to decrease cycle time 1. To investigate fillrates, images from the experiment were taken at differentstages of filling, the outline of the material digitized, andthe volume of material inside the bucket calculated andexpressed as a percentage of the maximum bucket volume.The maximum bucket volume of 0.0146 m3is defined inFig. 2b. Using the DEM results, the same procedure wasfollowed and the results compared.Fig. 12 shows the experimental results using three differ-ent rig angles. The bucket fill percentage is plotted againstbucket displacement in terms of bucket-lengths. In thedragline industry, the target is to get the bucket completelyfilled in 23 bucket-lengths. With an increase of the rigangle from 0? to 10?, there is a slight increase in fill percent-age towards the latter stages of filling. This is due to thefact that when material is disturbed, it flows more easilyinto the bucket. When the rig angle is further increasedto 20? there is, however, a decrease in fill percentage. A fur-ther investigation showed that with an increase in rig angle,the bucket displacement into the material is less. It hasbeen shown that the force perpendicular to the materialsurface is given by Wb? cos (h). Hence, with an increasein the rig angle, the force component forcing the bucketto dig in, decreases. When this force component decreases,the penetration depth of the bucket into the material isreduced and the bucket scoops up less material. Whenthe bucket scoops up less material, there is a decrease in fillpercentage.The comparison between experimental and DEM fillpercentages is summarised in Fig. 13. Using three rigangles h = 0?, 10? and 30? and two effective bucketweights Wb= 49.1 N and 138.3 N, the fill percentagewas calculated at displacements of 100, 200, 300, 400,500, 600 and 700 mm. The 42 data points were plottedand the two lines indicate that in all cases, except fortwo, the DEM results were within 6% of the experi-mental results.In practice, the bucket is rotated to prevent the majorityof the material to fall out when the bucket is disengaged.This principle is depicted in Fig. 14 where, at the end ofits displacement, the bucket was lifted out of the materialand kept at the rig angle. The effect of bucket orientationis clear on the amount of material that the bucket couldhold. Again, the experimental free surface outline is shownon the DEM results with good agreement for h = 0?. Forh = 20?, the DEM model predicts additional material inthe back of the bucket which can be explained by the differ-ence in the final fill state as seen in Fig. 6 at a displacementof 800 mm.0.511.522.50102030405060708090100Displacement bucket lengthBucket fill % = 0 = 10 = 20 Fig. 12. Bucket fill percentage as a function of bucket displacement fordifferent rig angles. = 0, Wb = 49.1 N = 10, Wb = 49.1 N = 20, Wb = 49.1 N = 0, Wb = 138.3 N = 10, Wb = 138.3 N = 20, Wb = 138.3 N102030Experimental %405060010203040Simulation %5060- 6% + 6% Fig. 13. Comparison between experimental and DEM fill percentages.C.J. Coetzee, D.N.J. Els/Journal of Terramechanics 46 (2009) 2172272256. ConclusionsThe main objective of this paper was to demonstratehow accurately the discrete element method can predictthe process of excavator bucket filling. The flow patternsof material entering the bucket, drag force acting on bucketdue to material interaction, energy requirements and thebucket fill rates were compared to experimental observa-tions and measurements. The study was limited to cohe-sionless granular material and two-dimensional models.The conclusions of the paper are:1. Comparing the material free surface, DEM can accu-rately model the flow of material into the bucket duringthe initial stages of filling. During the latter stages of fill-ing DEM, however, fails to accurately predict the mate-rial free surface.2. DEM can accurately predict the general trend in bucketdrag force. Over the complete drag of 800 mm DEMpredicts a drag force 1550 N lower than the measuredvalues. The maximum measured drag force is 250 Nwhile DEM predicts a maximum drag force of 200 N.3. DEM fails to accurately predict the drag energy. Thegeneral trends are however correct and it is shown thatthe drag energy increases linearly with an increase inbucket weight.4. Based on the DEM results, between 20% and 30% of thetotal bucket force acts on the lip. With the currentexperimental setup this cannot be validated.5. The DEM results show
温馨提示:
1: 本站所有资源如无特殊说明,都需要本地电脑安装OFFICE2007和PDF阅读器。图纸软件为CAD,CAXA,PROE,UG,SolidWorks等.压缩文件请下载最新的WinRAR软件解压。
2: 本站的文档不包含任何第三方提供的附件图纸等,如果需要附件,请联系上传者。文件的所有权益归上传用户所有。
3.本站RAR压缩包中若带图纸,网页内容里面会有图纸预览,若没有图纸预览就没有图纸。
4. 未经权益所有人同意不得将文件中的内容挪作商业或盈利用途。
5. 人人文库网仅提供信息存储空间,仅对用户上传内容的表现方式做保护处理,对用户上传分享的文档内容本身不做任何修改或编辑,并不能对任何下载内容负责。
6. 下载文件中如有侵权或不适当内容,请与我们联系,我们立即纠正。
7. 本站不保证下载资源的准确性、安全性和完整性, 同时也不承担用户因使用这些下载资源对自己和他人造成任何形式的伤害或损失。
提示  人人文库网所有资源均是用户自行上传分享,仅供网友学习交流,未经上传用户书面授权,请勿作他用。
关于本文
本文标题:ZL15装载机总体及变速箱设计任务书(3轴及齿轮)【全套CAD图纸+WORD毕业论文】【工程机械】
链接地址:https://www.renrendoc.com/p-395877.html

官方联系方式

2:不支持迅雷下载,请使用浏览器下载   
3:不支持QQ浏览器下载,请用其他浏览器   
4:下载后的文档和图纸-无水印   
5:文档经过压缩,下载后原文更清晰   
关于我们 - 网站声明 - 网站地图 - 资源地图 - 友情链接 - 网站客服 - 联系我们

网站客服QQ:2881952447     

copyright@ 2020-2025  renrendoc.com 人人文库版权所有   联系电话:400-852-1180

备案号:蜀ICP备2022000484号-2       经营许可证: 川B2-20220663       公网安备川公网安备: 51019002004831号

本站为文档C2C交易模式,即用户上传的文档直接被用户下载,本站只是中间服务平台,本站所有文档下载所得的收益归上传人(含作者)所有。人人文库网仅提供信息存储空间,仅对用户上传内容的表现方式做保护处理,对上载内容本身不做任何修改或编辑。若文档所含内容侵犯了您的版权或隐私,请立即通知人人文库网,我们立即给予删除!