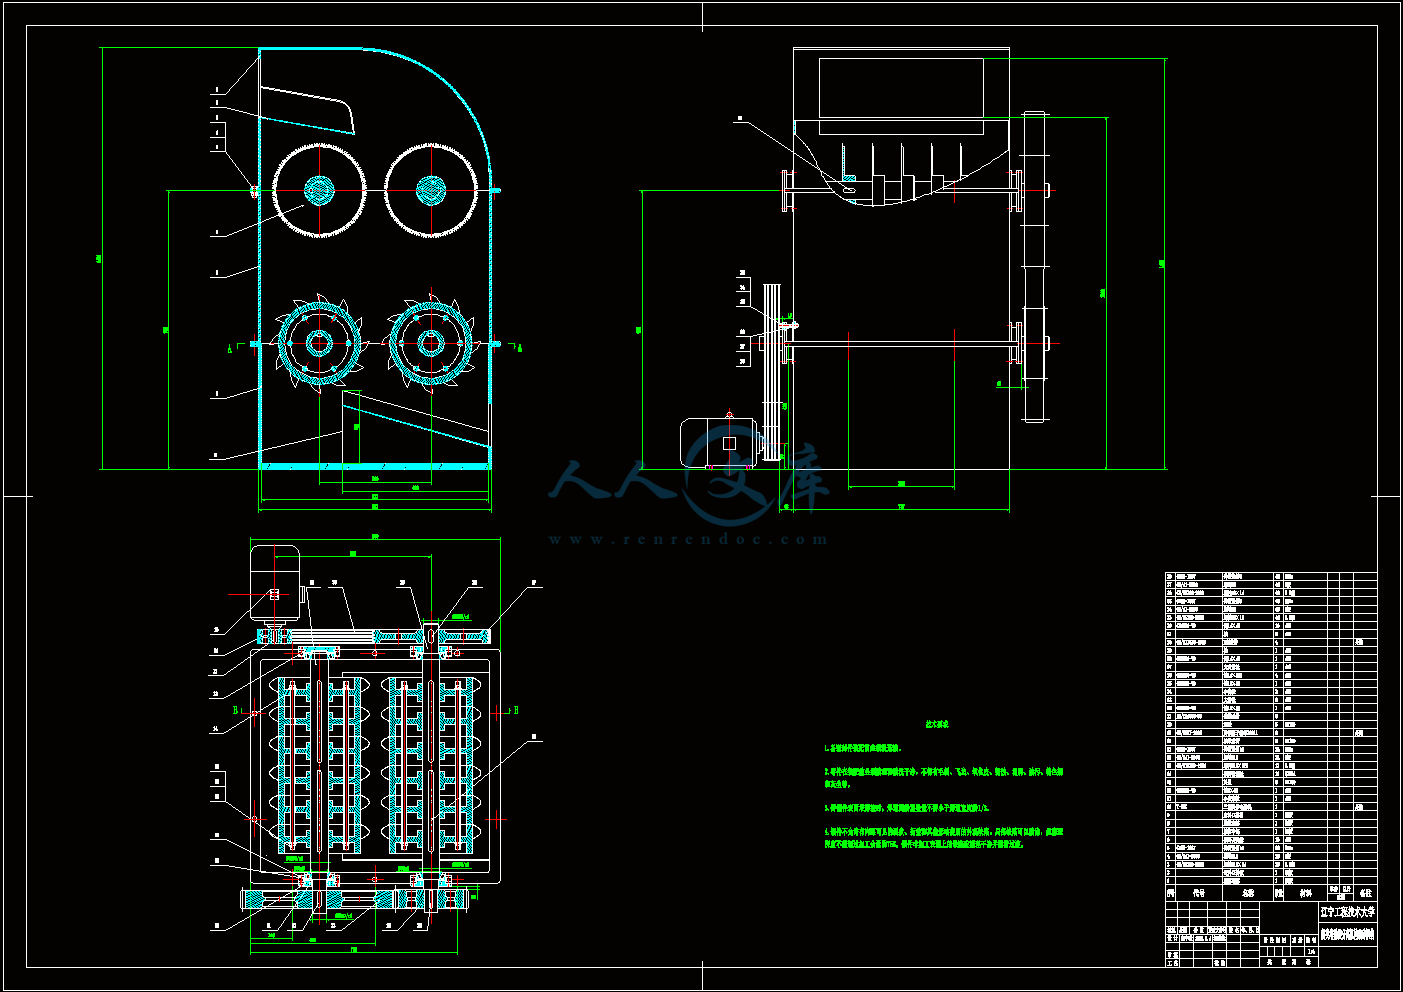
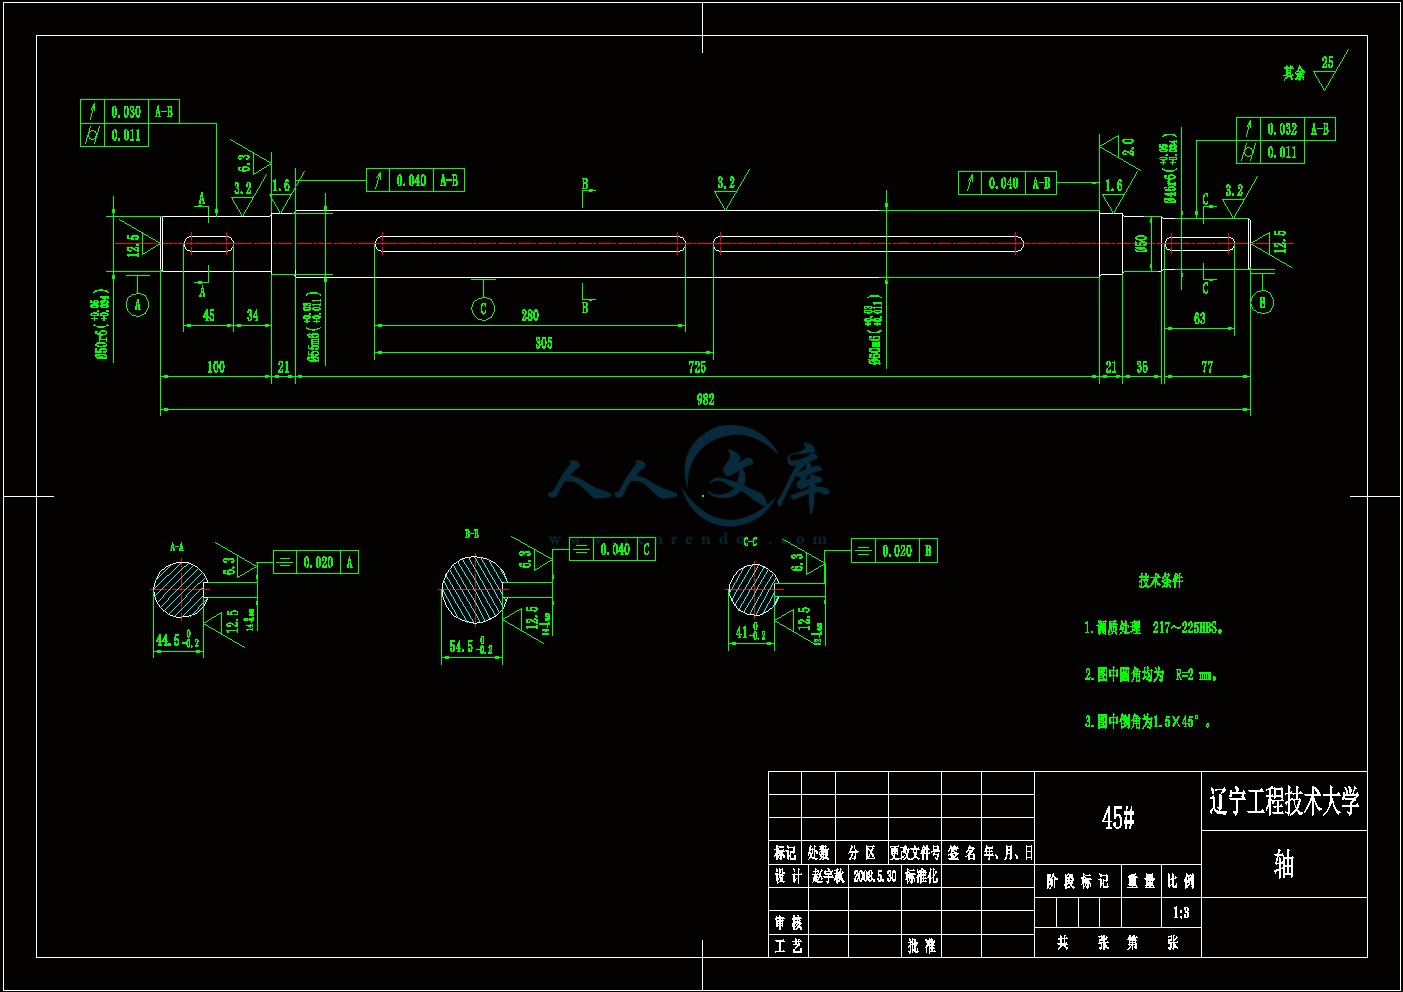
齿轮零件图.dwg
齿轮零件图.dwg

菌类培养袋分离机构设计【开题+翻译+实习】【3张图纸】【优秀】

收藏

压缩包内文档预览:
预览图
编号:422836    类型:共享资源    大小:8.22MB    格式:RAR    上传时间:2015-04-07 上传人:上*** IP属地:江苏
39
积分
关 键 词:
菌类 培养袋 分离机构 设计 开题 翻译 实习 图纸 培养袋分离机构 菌类培养袋
资源描述:

菌类培养袋分离机构设计

45页 13000字数+说明书+实习报告+开题报告+外文翻译+3张CAD图纸【详情如下】

内封.doc

实习报告.doc

摘要.doc

机械外文翻译--现场测量的作用.doc

目录.doc

菌类培养袋分离机构装配图.dwg

菌类培养袋分离机构装配图.exb

菌类培养袋分离机构设计开题报告.doc

菌类培养袋分离机构设计说明书.doc

轴零件图.dwg

轴零件图.exb

齿轮零件图.dwg

齿轮零件图.exb

目录

前言1

1培养袋破碎机构的简介3

1.1关于蘑菇培养袋与培养基分离措施的分析3

1.2培养袋破碎机构的工作原理3

2破碎机构的结构尺寸5

2.1箱体尺寸的确定5

2.2工作机构部分尺寸的确定6

2.2.1破碎齿辊轮结构的分析6

2.2.2破碎齿辊轮尺寸的确定8

2.2.3破碎刀具轮的尺寸确定9

3选取电机11

3.1选择电动机系列11

3.2选择电动机功率11

4各轴段轴径的确定13

5轴承型号的选择15

6 V带传动的设计计算16

6.1确定设计功率16

6.2选择带型16

6.3确定小带轮基准直径16

6.4确定大带轮基准直径17

6.5验算带的速度17

6.6初定中心距18

6.7计算基准长度18

6.8计算实际中心距18

6.9计算小带轮包角19

6.10确定V带根数19

6.11确定单根V带的预紧力21

6.12计算作用在轴上的压力21

6.13带轮材料和结构的确定22

6.14带轮结构尺寸的确定22

7齿轮尺寸的确定:24

7.1选择齿轮材料24

7.2按齿面接触疲劳强度设计计算24

7.3齿根弯曲疲劳强度校核计算28

7.4齿轮其他尺寸的计算29

8各轴段长度的确定31

9键的选择及强度校核32

9.1键的选择32

9.1.1键联接的定义及分类32

9.1.2键联接的选择32

9.2键的强度校核33

9.2.1键尺寸的确定33

9.2.2键强度的校核34

10结论38

致谢39

参考文献40

附录A41

附录B52

摘要

目前,随着我国人民的文化生活和物质生活的提高,人们对精神生活的要求也越来越高。其中对饮食的享受就占很大的比列。众所周知,蘑菇的味道十分鲜美,并且深受大家的喜爱。据了解蘑菇已经是世界上人工栽培最广泛,消费量最大的食用菌。但是在蘑菇的培养过程中,却产生了很多急需解决的问题。就拿如何处理用完的培养袋和培养基这个问题来说,我们就会发现其中有很大的研究价值。

   本文对如何去分离培养袋和培养基并进行回收进行了综合阐述,对分离培养袋和培养基的方法进行了分析和研究;经过仔细的论证,确定了培养袋分离机构的具体方案。结合常用农用机械中的破碎机构以及矿山双齿辊破碎机的机构,对分离机构的破碎部分进行设计,形成了具有自己特色的破碎工作机构。

   该破碎机构可以很方便的将培养袋和培养基分离,并能节省大量的人力和物力,而且也能为很多蘑菇种植场创造出额外的利润。极大的增大了蘑菇培养袋和培养基的回收和利用的效率,对防止造成“白色污染”,节约资源起到了很大的作用。

关键词:培养袋;破碎;齿辊;物料

   蘑菇培养袋为食品级塑料袋,比一般塑料较硬,而培养基为锯末等混合物,凝结成块并与培养袋粘在一起。要想将培养袋与培养基分开,就必须采取某种措施使培养基与培养袋不再黏粘在一起,并使凝聚成块的培养基变成很小的颗粒状;若要实现这种想法,可有很多种方式,绞、切、磨、挤,等等。

   若是通过绞碎的方式分离培养袋和培养基,虽然破碎效果较为明显,但是生产效率比较低,而且容易使塑料和培养基的颗粒相当,不易分开,所以用绞碎的方式不合理;若是用切割的方式去分离,虽然保持了培养袋较大的颗粒状,但是由于培养基与培养袋之间的黏着,很难将两者彻底分开,所以用切割的方式也不合理;若是采用磨碎的方式,则机器结构会很复杂,而且要求也比较高,造价也会很高,所以不宜采用磨碎的方式;挤压分离的方式,虽然结构相对简单,但是工作效率低,而且不能保证每个培养袋都能被分开,所以也不宜用这种方式。综合来看,若是将切割和挤压这两种方式结合起来,破碎效果则非常显著。

   这种方式是将培养袋用某种刀具破碎开来,然后通过挤压的方式使培养袋与培养基不再粘结,培养基不再凝聚成块,最后用振动的方式即可让破碎后的培养袋与培养基分开。根据实地考察,收完蘑菇后的培养袋一般比较柔软潮湿,可先放在空旷处进行晾晒,便于进行破碎工作。对于,蘑菇培养袋这种比较柔软的东西,不宜整体挤压破碎,但是若采用刀具先将培养袋切割成段状,然后再进行挤压就十分容易使培养基与培养袋之间不再黏着,也可使培养基不在凝聚成块并被磨成较小的颗粒,而破碎后的培养袋与培养基的混合物料通过振动的方式便可轻松分开。所以设计的分离机构可以分成两部分:破碎部分和筛分部分。而我重点设计的部分就是破碎部分。

1.2 培养袋破碎机构的工作原理

   对于培养袋的破碎机构主要是参考煤矿破碎机工作机构的工作原理去设计,它的主要优点是:结构简单,机体紧凑轻便,价格低廉,工作可靠,调整破碎比比较方便。缺点是:生产能力较低,要求将物料均匀连续地喂到破碎轮全长上,否则破碎轮磨损不均,且所要破碎的物料也不易均匀,需要经常修理。

   破碎机构的工作部分如图1.2-1所示,该部分主要由两对轮组成:上面的一对轮装有锯齿形刀具,目的是为了将培养袋切割成条段状;下面一对轮是表面比较粗糙的辊轮,用于进行二次破碎,通过挤压力使培养基与培养袋之间没有黏着力,并使本来凝聚成块的培养基变成很小的颗粒物。另外一方面该工作机构的上下两对轮的左右两部分的转速也是不同步的,正因如此,左右两轮之间形成了一个“搓”力,“切”的力与“搓”的力、“挤”

的力与“搓”的力两者的相互叠加使破碎效果更加显著,也让后期的筛分工作变得十分简单。

内容简介:
中文题目:菌类培养袋分离机构设计副 标 题:破碎机构设计外文题目:THE DESIGN OF FUNGI ISOLATED TRAINING BAGS毕业设计(论文)共 75 页(其中:外文文献及译文35页) 图纸共3张 完成日期 2008年6月 答辩日期 2008年6月辽宁工程技术大学本科生实习报告书教学单位 机械学院 专 业 机械工程及自动化 班 级 机械04-2班 学生姓名 赵宇秋 学 号 0407100234 指导教师 张建卓 为了让我们更好的把理论与实际相结合,学校安排我们在毕业设计前4周通过去机械类的厂家实习来熟悉所选毕业设计题目。在张建卓老师的带领下,我们来到阜新北鑫星液压有限公司进行实习。阜新北鑫星液压有限公司是生产高压齿轮油泵的专业厂家。其主导产品为P7600系列、CBP系列、CBG系列、CBF-E系列、CBF-F系列、CBZ系列、汽车转向助力泵系列、自卸车举升泵系列等。广泛应用于装载机、重型汽车、推土机、叉车、吊车、挖掘机、压路机、压缩式垃圾车等工程机械及起重机、运输机械、油田机械、矿山机械和环卫机械的液压系统中。同时还可根据用户的要求,提供特殊规格的齿轮油泵和齿轮马达,各种进口工程机械用齿轮泵的设计、制造及维修。实习过程中,通过工人师傅和张老师都为我们认真的讲解,我们掌握了很多在学习过程中不明白的东西,也真正领悟到一些液压元件的工作原理,还见识到了数控机床和加工中心。我们都仔细的观察和询问,这时候我才知道“理论与实际相结合”这句话的奥妙,只有在实践中去体验去操作才能更好的掌握知识。看着有些工人师傅们熟练的操作机床生产液压配件,而有些则细心的装配液压元件,我心里突然有一种感触,在社会这个大竞技场里,没有一身的本事,何以去生存!在生产车间,负责人带我们参观了他们的生产装配流水线。当时工人师傅们都在加工齿轮泵的零件。有的在加工泵的壳体,有的在加工齿轮。齿轮泵是液压传动系统中常用的液压泵,它是通过密闭在一个壳体内成对齿轮进行啮合运动而工作的。按啮合方式的不同,齿轮泵可分为外啮合式和内啮合式两种。其工作原理是利用齿轮的旋转,使密封体积发生变化,进而形成一种压力,随着齿轮的连续转动,齿轮泵则连续不断地吸油和排油。若改变传动轴的转向,齿轮泵的吸、排油方向也会改变。车间里的几台数控机床和加工中心也各自工作着,有的在加工模具,有的在加工精度较高的零件。数控机床工作原理是按照零件加工的技术要求和工艺要求,编写零件的加工程序,然后将加工程序输入到数控装置,通过数控装置控制机床的主轴运动、进给运动、更换刀具,以及工件的夹紧与松开,冷却、润滑泵的开与关,使刀具、工件和其它辅助装置严格按照加工程序规定的顺序、轨迹和参数进行工作,从而加工出符合图纸要求的零件。数控机床主要由控制介质、数控装置、伺服系统和机床本体四个部分组成。数控机床的加工过程:(1)控制介质:控制介质以指令的形式记载各种加工信息,如零件加工的工艺过程、工艺参数和刀具运动等,将这些信息输入到数控装置,控制数控机床对零件切削加工。(2)数控装置:数控装置是数控机床的核心,其功能是接受输入的加工信息,经过数控装置的系统软件和逻辑电路进行译码、运算和逻辑处理,向伺服系统发出相应的脉冲,并通过伺服系统控制机床运动部件按加工程序指令运动。(3)伺服系统:伺服系统由伺服电机和伺服驱动装置组成,通常所说数控系统是指数控装置与伺服系统的集成,因此说伺服系统是数控系统的执行系统。数控装置发出的速度和位移指令控制执行部件按进给速度和进给方向位移。每个进给运动的执行部件都配备一套伺服系统,有的伺服系统还有位置测量装置,直接或间接测量执行部件的实际位移量,并反馈给数控装置,对加工的误差进行补偿。(4)机床本体:数控机床的本体与普通机床基本类似,不同之处是数控机床结构简单、刚性好,传动系统采用滚珠丝杠代替普通机床的丝杠和齿条传动,主轴变速系统简化了齿轮箱,普遍采用变频调速和伺服控制。数控加工中心的工作原理是:加工中心的工作原理是根据零件图纸,制定工艺方案,采用零件加工程序,把加工零件所需的机床动作和全部工艺参数变成机床的数控装置能够接受的信息代码,并把这些信息代码存储在信息载体上,将信息载体送入输出装置,读出信息并送入数控装置。信息进入数控装置以后,经过处理和运算转变为脉冲信号,这些信号有的送到机床伺服系统,驱动机床有关零部件,使机床产生相应运动,有的送到可编程序控制器中控制机床的其他辅助动作,实现刀具自动更换。最后我们负责人带我们看了他们的装配车间和储藏库,以及齿轮泵的检测工作。 在阜新北鑫星液压有限公司的实习,使我们了解了目前制造业的基本情况,只是由于机械行业特有的技术操作熟练性和其具有的较大风险性,很遗憾地,不能多做一些具体实践的操作,但是观察了一些液压件的各个零件的生产加工过程及其装配过程,使许多自己从书本上学的知识鲜活了起来,明白了本专业在一些技术制造上的具体应用。指导教师意见成绩评定:指导教师签字: 年 月 日 实习单位意见负责人签字:(单位盖章)年 月 日备注注:实习结束时,由实习学生填写本表后,交指导教师和实习单位签署意见,最后交所在教学单位归档保管。摘要目前,随着我国人民的文化生活和物质生活的提高,人们对精神生活的要求也越来越高。其中对饮食的享受就占很大的比列。众所周知,蘑菇的味道十分鲜美,并且深受大家的喜爱。据了解蘑菇已经是世界上人工栽培最广泛,消费量最大的食用菌。但是在蘑菇的培养过程中,却产生了很多急需解决的问题。就拿如何处理用完的培养袋和培养基这个问题来说,我们就会发现其中有很大的研究价值。本文对如何去分离培养袋和培养基并进行回收进行了综合阐述,对分离培养袋和培养基的方法进行了分析和研究;经过仔细的论证,确定了培养袋分离机构的具体方案。结合常用农用机械中的破碎机构以及矿山双齿辊破碎机的机构,对分离机构的破碎部分进行设计,形成了具有自己特色的破碎工作机构。该破碎机构可以很方便的将培养袋和培养基分离,并能节省大量的人力和物力,而且也能为很多蘑菇种植场创造出额外的利润。极大的增大了蘑菇培养袋和培养基的回收和利用的效率,对防止造成“白色污染”,节约资源起到了很大的作用。 关键词:培养袋;破碎;齿辊;物料 AbstractAt present, as our peoples cultural life and improve the material life, spiritual life of the people are getting higher and higher requirements. One of the restaurants on the enjoyment of great than out. As we all know, the mushroom flavor is very tasty, and by everyones favorite. It is understood mushrooms is already the worlds most extensive artificial cultivation, consumption of the largest edible fungi. However, in the course of the cultivation of mushrooms, they have a lot of urgent problems. Take how to deal with the training kit and used the medium of this issue, we will find a great research value. This article on how to separate culture and media kits and a comprehensive recovery on the separation of media kits and training methods for analysis and research; after careful evaluation to determine the training bags from the specific programmes. With commonly used agricultural machinery in the broken bodies, as well as mine double Roll Crusher institutions, separation of the broken parts of the design, formed its own broken body of work. The broken bodies can easily be training kits and medium separation, and can save a lot of manpower and material, but also for many mushroom plantations create additional profits. Greatly increase the mushroom cultivation bags and medium recovery and utilization of efficiency, to prevent the white pollution, resource conservation played a significant role. Key words: training kits; broken; Roll; materialsII辽宁工程技术大学毕业设计附录A现场测量的作用摘要本文描述了用于全地形带式输送机系统的现场测量的模型和设备。将理论计算与现场测量进行了比较。阐述了现场测量如何通过对预期设计性能和实际性能的对比确定偏差。由于带式输送机的项目资本和运营费用具有非常重要的意义,所以输送带的力、强度和预期寿命的准确的理论预计正在变成重要的设计工具。准确的现场测量是证明理论的唯一真实方法,因此在证明理论模型的准确性上具有特殊意义。不精确的预计会导致失败的严重风险以及造成客户的项目资本和运营费用的浪费和过度支出。 引言这本学报刊登了很多关于长距离带式输送机系统设计的分析和数学建模的文章。仅有很少的几篇文章讨论了系统一旦投入运行和使用的实际性能。这篇文章描述了测试方法学、相关设备及输送机动力公司对投入运行的长距离带式输送机的一些测量结果。它将论证通过对设计报告中描述的预期性能与实际性能对比以确定其偏差的现场测量的作用。对系统组成部分(例如制动或驱动控制器)的设计调整的改变都可能导致操作上的问题。为了最大限度地理解导致这些问题的因素,并给出适当的解决方案,理解带式输送机系统动力的理论背景非常重要。对理论演算和大量的现场测量进行了比较。这篇文章的第一部分仅介绍了可用现场测量的一部分。第二部分着重介绍了带面行程、输送机部件噪音、输送带震动,以及加速度测量。2 输送机系统来自澳大利亚昆士兰的Barclay Mowlem和Moorooka指定输送机动力公司为西电公司设计木加发电站专用的P2型带式输送机,如图1所示。木加发电站坐落在澳大利亚西部柯利镇附近。P2型输送机是从煤矿向木加发电站运输煤炭的带式输送机中最长的一条。输送机大约为6.1km长,并且从尾部到顶端滚筒的高差为15m,如图2所示。输送机共有29处垂直弯,14处内凹弯和15处外凸弯。内凹弯的最小半径为1500m,外凸弯为800m。输送机还有一个半径为4500m的水平弯。设计报告于1997年1月完成,场地测量于1998年1月前进行。P2型带式输送机主要的设计参数如下:运料煤炭运力770t/h密度850kg/m超载角度20输送带平均张力800 N/mm宽度800mm电动机2 315 kW双向驱动头部布置 计算机设计工具稳定状态和动态分析方法被用于对输送带应力、张紧力水平和启动以及制动的控制方法学的确定。在进行稳定状态分析时输送带被假定为一个刚性(无弹性)体。动态分析使用二维波动理论确定通过输送带上张力的传递时间。为了进行动态分析,输送带被划分成一系列包含有弹性机构、缓冲筒的独立的单元,如图3所示。其中的符号在3中给出。流变学定律确定了它们之间的相互作用。大振幅的张力波,有时指的是“冲击波”,并且局部的输送带位移只能通过动态分析解决。稳定状态分析会产生因所有负载情况和温度变化而引起的连续传送带张力和电力消耗。一种牌号为BELTSTAT的计算机程序,被用于分析稳定状态设计。动态分析在带式输送机的非稳定操作阶段,比如启动和制动阶段,产生输送带张力和动力的消耗。动态分析在牌号为BELTFLEX的计算机程序中执行。动态分析常用于以下方面:a. 模拟将所有马达和刹车(如果有)的启动和制动控制功能集成的输送带的弹性反应模型;b. 发展控制策略和动态调整方法(如果必须),以便将输送带张力和位移限制在可以接受的范围之内;c. 分析和控制在“如果”在启动和制动过程中出现故障的原因和影响。4 设计参数设计长距离带式输送机的公司可能不从事生产。如果设计者和生产者相同,那么客户通常要联系顾问公司检查他们的工作。设计者和顾问公司可能都会要求进行现场测量。其主要原因就是要确认系统的建立与设计者预期的参数和性能相符。设计报告是现场测量与设计参数进行比较的基础。设计报告中的典型设计参数如下:1. 物料:吨位、密度和超载角度;2. 输送带:宽度、强度、厚度、数量、模数、速度和最低配置;3. 驱动集合:额定功率、惯性、驱动数、位置、效率和离合器比率;4. 机架:尺寸、型号、位置;5. 飞轮:尺寸、型号、位置;6. 牵引系统:位置、作用在滑轮上的输送带轴线张力、总牵引位移;7. 托辊:托辊空间、滚动尺寸、载荷、数量;8. 滑轮:布置、尺寸以及和输送带轴线偏差;9. 弯曲:尺寸、弯曲处输送带压力、断裂分析;10. 输送带震动分析;11. 启动控制;12. 制动控制,包括连接输送机之间的连续规则。现在,客户可能要求长距离带式输送机供应商保证在最小投资和操作成本基础上建立系统。他们还会要求在计划路线和最大替换率基础上运输设计吨位物料的输送机部件效率参数,比如托辊和输送带。因此它被认为是应该在设计报告中给出的系统参量。这些值可以与设计计算中的预期值不同。设计值和期望值之间的空白要靠计算机设计工具来填补。设计值与预期值之间的典型比例为10%。由于计算设计工具的不精确性,在陆用输送机的设计上很少能达到这个比例。 程序与设备大多数主要的输送机部件比如驱动,制动和牵引系统都布置在系统的头部或尾部。因此,大部分的测量都集中在这两个位置进行。不幸的是,这些区域都属于高压区和强波动区。由于这些原因,应用在场地中的数据获得设备需要有极大的强度。这种设备不仅要具有抗高压脉动和过载能力,还要有轻便、可靠和低噪音特性。下面是输送机动力公司用于获得大型全地形输送机数据的设备的简单介绍。5.1 数据获取记录器所有场地设备的基础就是数据获取记录器。这个装置将各种变换信号数字化并储存在一台便携式电脑中。同一台数据获取记录器可以用来记录50个以上的信号。样品率取决于信号及时和结果的期望的准确性改变的率。典型地,样品率变化在0.1Hz 之间对10 kHz。高采样率例如必需充分地获取马达和闸扭矩瞬间,速度变动由瞬变重音造成波动,牵引机构动作,马达接触器反应,阀门和轮尺时间,等等。低采样率被用于作为记录重量标度和温度测量。为保证每次现场试验适当的记时,所有数据记录单位必须“被触发”或同时开始。由于全地形输送机常跨越广大的地形,所以做到这一点很困难。如果在输送机的两端可编程控制器的信号均可用,则按键触发器信号可能被编如可编程控制器。这个信号之后将被传递到输送机的另一端,同时所有数据记录器启动。这就引起了50ms之内的延迟。其它的方法包括口头读秒(如果通讯可用),或者两个用户在预设的时间间隔内都触发信号。两种形式的测试方法可以被预先设定。第一种是“静态”方法。由于这个方法所有数据记录器同时被触发。数据在预设的时间间隔内以固定的采样率被记录。例如,60秒钟测试以10Hz 的采样率可能被用于获取输送机系统的启动或制动。这个方法不幸地要求预先的知识, 输送机是开始或停止和数据记录器必须被触发在事件发生之前。虽然高采样率可能必需在开始和停止输送机机期间, 这些比率不是为长期测试所中意的。这种方法的缺点在于所记录的大量数据集中于高采样率和长时间间隔中。第二种解决问题的方法是允许在预设的高采样率和平稳运行状态以及停车期间的低采样率之间变动的“动态”测量法。这个方法数据记录器被设置为对样品的高采样率。然后它们被同时触发。在指定的间隔时间以后, 比方说500秒, 记录的数据被分析。如果输送机的速度显著改变了, (输送机启动或制动)数据在间隔时间后被保存到指定的文件。如果速度未改变(输送机不运行或处于稳定状态)然后动力, 温度, 和或其它稳定状态数据可能被按时间平均分配并被保存到独立的数据文件。这种方法更多地应用于静态测试之后,但是允许进行长期测试。它还能使工程师对输送机进行紧急制动。52 输送机带速绝大多数现场测试的基础之一就是带速测定。这个测试不仅关系到输送机设计速度的准确性的确认,还关系到整个输送机系统启动和制动的动力确定。当前,确定输送机速度的两个最普遍的方法是使用一个磁性传感器和光学编码器。磁性传感器需要一个旋转金属盘或齿轮牙从接收的信号中选择信号或者脉冲。这种装置可能有1-32个预设的脉冲信号。虽然有这些设备引起的错误在输送机稳定状态速度下能被接收,但是它们的准确性在低速时被严重降低。因为在输送机启动或制动时速度通常被作为可编程控制器的反馈信号,它们的错误可能会非常严重。例如,一个带有16个预设脉冲信号的磁性传感器在一个直径为1,800mm的带轮以5.6rad/s的速度(带速为1m/s)转动时,每350ms只能产生1个脉冲信号。另一方面光学编码器使用一张被铭刻的通过一个光电二极管转动的玻璃盘。这些设备能很容易地包含2,000个预设脉冲。在上面的例子中,在同一个系统上对应的光学编码器每3ms将引起1脉冲。此外,不同于电磁式拾波器,光学编码器可能输出一个双重求积分法信号,造成加倍信号计数每次旋转。这提供了更高的噪声屏蔽,推断旋转的方向的能力,和更加准确的信号。图4所示为一个典型的光学编码器。光学编码器和滚轮被集成安装在铝制的臂形结构上。速度编码器可以多个并联使用,如图5所示。这里两个速度编码器用于测量可能的输送带滑移量。一个被安装在输送带旁,测量输送带的实际角速度。另一个安装在滚筒防护套上,用来测量滚筒的实际角速度。被记入半径偏差的二者之间的所有速度偏差,都是输送带打滑的标志。5. 输送机动力与电动机转矩必须进行准确的动力测定以确定稳定状态计算的结果,保证足够的安装动力,并证实设计的准确性。共有三种常用的测定动力的方法。第一种是使用动力变换器(瓦特表)。动力变换器测量即将驱动系统的电流强度和电压。稍后将成为电动机动力。不幸的是这种形式的测定包含了电动机、变速箱、联轴器,和/或其它的电能及机械能损失。必须排除这些损失以确定输送机所消耗的动力。第二种方法仅应用于特殊的机构形式。另外,由于这种方式的测量包含了变速箱、联轴器及其它中间设备的动力损失,所以作用在驱动带轮低速轴上的动力无法直接确定。第三种方法是直接测量由连续转矩引起的带轮轴上的拉紧力。这可以直接转变成驱动转矩。转矩是输送机运行速度与被带轮半径分开的独立的驱动力的乘积。图6显示的是获得精确转矩的必备设备。拉紧测量仪安装在变速箱和/或滑轮轴上。由于杆的转动,电线无法从数据获取设备直接连接到这些测量仪上。就必须使用滑动铃或无线方式。滑动铃是典型的由于其高噪音,和不可安装的几何外形而不能被接受的设备。无线方式则被证明是可接受的并且是可靠的。小型的电池动力转换器和转换天线安装在转动轴上。转换器作为动力源和拉紧测量仪的放大器安装在轴上。它稍后将拉紧测量仪输出转换成5kHz的脉冲调频信号。这个信号是由安装在轴外部的静态接收天线转换的。接收天线连接到将脉冲调频信号还原成DC电压的接收元件上。之后数据获得记录器得到了这个电压。图7显示的是从一台绕线转子电动机启动过程中进行的转矩测量的结果。反向转矩和稳定状态转矩都已示出。另外,二十五个电阻极中的任何一个和它们的启动顺序都能够被识别。稳定状态转矩信号的快速傅立叶变形中包含了一个有趣的结果。系统可以通过包含于转矩信号中的大量信息确定。图8所示为系统结构和运用于稳定状态转矩信号的傅立叶变形的结果。这个系统由鼠笼式电动机、联轴器、变速箱和驱动带轮组成。拉紧测量桥安装在变速箱和驱动带轮之间的轴上。图8中的X轴已经从一个频谱变成了同轴角速度。由于一个小的欠对准,在传动系统中,联轴器的高频率转矩成份被传输,经过齿轮箱传递到驱动滑轮。这些部分均显示在图8中。这些频率组分允许计算通过联轴器的滑动。其次,通过了解角速度,可以通过电动机滑动弯曲计算转矩。这个计算转矩相对于实际测量转矩可以存在3%以内的误差。另外,明确表示出了滚筒轴的角速度,并且可以计算出输送机运行速度。这个速度相对于测量速度的误差不超过5%。其余的频率峰值反映了变速箱的缩减量级和它们的较高的调和函数。5.4 牵引张紧力从转矩测量的结果可知,驱动带轮各点的张力是不同的。获得两个张力中真实的一个张力值,已经被作为参考。最便于测量的张力是牵引张力。这个张力就是前面提到的被作为参考的张力。牵引张力通常采用安装在牵引系统线序中的承载单元来进行测量的。如果可能,可以使用成熟和标准的承载单元。这样在张力测量过程中所产生的错误就会相对减少1%。另一方面,牵引结构本身可能就是拉紧力测量仪并且用作于承载单元。图9显示的是安装在木加P2型输送机重力牵引线终止端的承载单元。5.5 牵引位移牵引位移是被测量出来以证实理论预报并确认牵引位移要求的。牵引位移的测量设备同测量输送机速度的设备是相同的。在这种情况下,对偶平方脉冲被记入时间以证明位移与速度的同步性。典型的位移仪器安装在牵引绳轮上,如图10所示。装配精度大约在1,000毫米范围内为5毫米。也就是说要比预期精度高99.5%以上。5.6 温度周围温度的变化会较大程度地改变输送机皮带覆盖的橡胶混合物的纤维弹性。这种改变通常作为设计参数给出并且为进行稳定状态分析而阐述。在输送带通过消耗输送机动力的传动滚筒时温度变化会影响橡胶变形。低温也会增加托辊承受的拉力。当输送机标高发生明显改变时,要求在机头和机尾都要进行温度测量。温度测量要求使用电热耦连续进行并且每次测量的结果都要用数据获取记录器记录下来。有时夏季和冬季都要进行测试以便证实伴随输送机温度变化而发生的动力脉动。5.7 制动转矩进行制动转矩的测量是为了证实该制动系统符合生产者和设计者的标准。制动转矩的测量技术与电动机转矩测量相同。图11显示了倾斜式输送机系统中转矩测量的典型排列。这种系统中,制动器被安装在变速箱输出轴与输送机机尾带轮之间。虽然图中显示的仅为制动盘的一面,但两面是用张紧力测量桥连接的。图12所示为上面以及在图11中描述的操作性制动的转矩测量结果。在测试中开始停车六秒。在那段时间之前,输送机处于其新生动力可计算的稳定运行状态。注意这两个转矩信号(作用于两个不同直径和壁厚的轴上)具有不到2%的差异。六秒钟之后,开始制动。一部分制动转矩用于停止输送机运转,同时其余的制动转矩用来停止电动机和飞轮。位于制动盘两侧的拉紧测量桥允许每个分转矩单独被确定。这些分转矩在稍后可以被合成总的制动转矩。制动转矩测量的总体误差取决于错误的速度测量(1%),转矩测量(2%)以及转轴材料(2%)。这就导致了一个小于5%的总体误差。5.8 重量等级通过对稳定状态和动态分析以及测量的结果的比较可知,确切的输送带的载荷非常重要。因此必须记录精确的重量等级指数。幸运的是多数陆用长距离输送机的重量等级在投入使用过程中已经校准。这样信号和适当的等级系数可以直接从可编程控制器上采用。认识到在取得测试时,输送带上的物料载荷与当前的重量等级指数是不相同的,这一点非常重要。为了确定输送带上载荷的正确外形,必须将测试前某段时间内的重量等级和速度记录下来。这段时间的长度至少要由稳定状态速度在输送机长度上划分。负载值可以由整个输送机长度合成,或者确定真实的输送带载荷。6 木加:理论与实践这部分要对理论预报和对木加P2型输送机进行的现场测量的结果进行比较。6.1 动力消耗正如前面第三部分提到的,客户有可能要求最小的效率规格,例如在根据最大W-hr/ton/km的数值,按照设计规格在计划路线上运输固体物料。对于陆用长距离输送机,运输效率主要取决于凹进辗压抵抗1。因此设计工具能否准确计算这种抵抗就十分重要。输送机动力公司以前所使用的设计工具被描述成2和3,其适用理论为4。图13所示为木加P2型输送机的测量动力消耗和预期值之间的比较。同时显示了通过常规CEMA模式5确定的期望动力消耗。在夏季事实建设并且数据仅仅对于这些情况有效(27摄氏度)。在图13中,点划线线显示了在1997年提交的设计报告中的设计动力消耗值。这些数值在第四部分的阐述中偏于保守。输送机动力公司的标准证明了输送带的长期变形、结构队列和负载变化(例如滚筒)引起的预期动力10%的下降。实线反映的是从设计计算中产生的预期动力消耗。设计动力和预期动力的最大差距为25kW(小于10%)。预期与实际测量动力值的平均偏差为4.3%。符合测量的精确度要求。设计值与测量值的平均偏差小于15%。要求的输送机动力是总摩擦阻力和物料总推力之和。摩擦阻力包括可以考虑为粘性(速度依赖)摩擦部分的滞后损失。它还不足以被看成是衡量输送机系统动力消耗合理与否的最大驱动力。比较不同的系统的动力消耗的最佳的方法比较他们的运输效率。这里有几种谷物保存的运输效率的方法。第一种也是运用最为广泛的一种就是比较等效的摩擦系数,比如DIN f系数。对于P2型输送机来说这个系数在输送带满载(770t/h)情况下为0.013。使用等效摩擦系数的优点在于可以确定空载输送带。其缺点是它并不是“纯”效率数。它被考虑在输送带、滚筒和运输物料的范围内。然而在纯效率数中,只需要考虑运输物料。第二种方法是比较运输费用,既可以按W-hr/ton/km,也可以按$/ton/km。对于P2型输送机,输送带满载时的运输费用为0.072kW-hr/ton/km。其优点是运输费用的广泛地应用于管理目的。缺点是它并不直接地反映系统的效率。第三种也是最“纯”的一种方法是比较运输效率数。运输效率数是克服摩擦损失(忽略驱动效率以及提升/降低物料所损失/获得的动力)的必须驱动力与运输做功的比值。运输做功是固体物料运输总量与输送机平均运行速度的乘积。对于P2型输送机,其运输功率数为0.025。例如,用这个数字可以对带式输送机和卡车系统进行比较。缺点是依赖与物料的运输量因而不能确定空载输送机。6.2 波动传递速度输送带的弹性以及输送带、托辊和物料决定了长距离带式输送机的动态特性。必须知道压力波通过输送带时的速度以确定合适的启动和制动程序。有两个波速需要区别:纵向波速和横波的传播速度。纵波速度取决于传送带的模数、输送带的截面积、输送带的材料和折算质量。如果输送带的参数已知,则输送带的预期纵波速度可以由理论计算得出。真实的波速则可以通过测量一个张力波由输送机头部传递到尾部的时间来确定。最适宜的确定波速测量是在紧急制动是测量输送机头部和尾部的带速。在紧急制动过程中,驱动力被取消,输送机头部输送带的张力发生突然而剧烈的变化。图14显示的是使用BELTFLEX程序计算并已经测量的输送机头部的带速。当t=0s时,驱动停止带速由4.4m/s下降到3.5m/s。图15显示输送机尾部的带速。在t=0s时尾部制动器启动引起带速下降。在t=3.1s时,来自输送机头部的张力波到达尾部,带速降至2.8m/s。时间延迟为3.1s。由此时间延迟划分开的6.1km输送机的长度,产生了这个波速。这种情况下,钢丝绳芯输送带的典型波速为1968m/s。这个波速被当作是一个标志。使用(已测得)输送带模数5154N/mm,和输送带密度1307kg/m,可以计算出理论纵波速度为1985m/s。与实际测量所得波速相差不到1%。在计算负载输送带波速时,需要考虑一部分折算质量和输送带载荷。当输送带负载时,波速会降低。图16用实际(通过测量确定的)波速与标志波速的比率显示了波速的下降。上面的曲线表示了仅考虑物料与输送带时的波速衰退。下面的曲线表示考虑滚筒情况下的波速衰退。两条曲线都考虑了100%负载情况。图16中的点表示了不同吨位情况下的波速比。可以观察到当输送带载荷变大时滚筒减弱变得更为普遍。输送带与滚筒之间的相对滑动随着带负载的增加而减小。6.3 动态调整确定驱动、制动和/或飞轮安装的程序被称为系统的动态调整。取消驱动力时,输送机头部的张力迅速下降。这一张力下降引起一个从输送机头部到尾部的反向张力波动。一台10kNm的制动器在紧急制动时要限制制动时间并防止在输送带W处拖动绳位置产生额外下陷,如图2所示。当驱动力消除时,输送带头部张力迅速下降到预紧力水平。这个张力下降在输送机头部产生一个反向的张力波,并且向驱动/牵引站张力较低点传递。如果不使用制动器,输送机将漂移停车并且张力在输送带的W处产生不可接受的下跌,幅度超过5%。尾部制动器需要在紧急停车时增加张力。一旦使用制动器,运载线张力增大,同时产生一个同向的张力波从制动带轮向输送机头部传递。如果制动器安装在尾部,则同向张力波会及时抵达输送带W处以抵消从驱动站产生的反向波动。如果安装在头部,则不能及时到达。在机尾出安装制动器的缺点在于当紧急制动时输送带返回线张力也会降到非常低。这些低张力可以在带轮周围产生一个高张力比。在实践当中,张力比受到输送带与带轮之间的摩擦和包角的限制。当达到最大张力比时,输送带开始打滑。因此在牵引装置上安装了绞盘。绞盘的作用是限制牵引装置从而防止输送带过松。它作用于输送带返回线张力水平相对较高的输送机上。绞盘的设计提升张力22.5kN,输送带平均拉力在30kN。在投入运行过程中,输送带和制动带轮,尾部制动转矩,以及牵引张力被测量以确定打滑因素。输送带和制动轮(图17),尾部制动转矩(18)和牵引张力(19)被测量出来以便确定打滑因素。图17显示的是在紧急制动过程中输送机头部和尾部的带速。绿线表示的是头部带速,蓝线代表尾部带速,红线表示制动轮上测量的(角)速度。紧急制动开始9秒钟后,输送带开始在制动轮上打滑。图18显示了紧急制动过程中的转矩。从这个图表中可以看出由于制动使设计转矩从10kNm变成了6到8kNm。由于张力比随制动转矩下降因此而没有引起打滑。图19显示了紧急制动过程中的牵引力变化。该图表显示出绞盘仅仅将22.5kN的设计张力提高了4到5kN。输送带在制动轮上的打滑是由绞盘故障所引起的。虽然张力比不能直接测量,但可以通过BELTFLEX程序解决该问题。使用低绞盘力,BELTFLEX预报张力水平如图17所示。从该图表中可以知道一旦张力比达到5,输送带即开始打滑。带有180度包角的输送带与陶瓷防护套之间的最大摩擦系数可以计算出为0.5。这大大低于生产者的0.8。现场测量显示出陶瓷防护套的摩擦因数仅仅能够安全地用于高张力带轮(驱动轮)上。对于低张力带轮(尾部/制动轮)实际摩擦系数要低得多。完整的图表:图20显示出了两个转矩中的驱动转矩。可以看出负载比率为1:1.16。驱动转矩由于阻碍的产生而在制动环末端产生。这个例子说明从系统组成部分(例如制动或驱动控制)的设计设定发生的改变可以导致非常严重的操作问题。7 结论1.设计报告用于作为对场地测量与设计规格比较的基础。因此报告中的规格应该详尽清楚。2.今天,对所有要求精确测量数据的全地形长距离带式输送机测试方法和设备均可应用。对带式输送机动态理论背景的理解是分析测试结果所必备的。3.测试结果与平稳状态和动态分析结果的比较显示出按照BELTSTAT和BELT-FLEX的计算是准确的。预期(计算)的结果与测试的结果的偏差不超过5%。4.现场测量是工程所必须的。即使稳定状态和动态分析可以被用于确定操作上的问题,现场测量也是确定系统参数实际设定所必须进行的。致谢 为成功的合作以及现场测量成果的发表向Barclay Mowlem致以真诚的谢意。37附录BThe Power of Field MeasurementsSummaryThis article describes current test methodologies and equipment used for field measurements of long overland belt conveyor systems. A comparison is made between the theoretical calculations and field measurement results. It is shown how field measurements can be, used to determine deviations from the actual system performance as compared to the expected design performance. Accurate theoretical performance prediction of the belts power, strength and life expectancy are becoming important design tools as the belt conveyors share of the project capital and operating expenses become significant. Accurate field measurements are the only true method of validating the theory and therefore assumes special significance in certifying the accuracy of theoretical models. Inaccurate predictions lead to either a serious risk of failure or wasteful and excessive expenditure of the clients capital and operating cost.1. IntroductionMany articles have been published in this journal on both analytical and numerical methods to design long overland belt conveyor systems. Only a few papers discuss the actual performance of the system once it has been erected and commissioned. This article will describe the test methodology, equipment and some measurements acquired by Conveyor Dynamics, Inc. (CDI) during commissioning of long overland belt conveyor systems. It will demonstrate the power of acquiring field measurements to determine deviations from the actual system performance as compared to the expected performance described in the design report. Changes from the design settings of system components (brakes or drive controllers for example) can result in serious operational problems. To fully understand the cause of these problems, and provide an appropriate solution, it is important to understand the theoretical background of the dynamics of a belt conveyor system. A comparison is then made between the theoretical calculations and certain field measurements. Only a part of the available field measurements will be described in Part I of this article. Part II will include a description of belt side travel, conveyor component noise, belt flap, and acceleration measurements.2. The Conveyor SystemFig.1 Beginning of the horizontal curve for Muja power station conveyor P2Barclay Mowlem, Moorooka, QLD, Australia, commissioned CDI to deliver the mechanical design of the Muja power station designated belt conveyor P2 for the Western Power Corporation (WPC), see Fig. 1. Muja power station is located in Western Australia near the town of Collie. Conveyor P2 is the longest of a series of conveyors that transport coal from the coal fields to Muja power station. The conveyor is approximately 6.1 km long and has an overall elevation increase of approximately 15m from the tail to the head pulley, see Fig. 2. The conveyor has 29 vertical curves - 14 concave and 15 convex curves. The minimum radius of the concave curves is 1,500m and 800m for the convex curves. The conveyor also has one large horizontal curve with a radius of 4,500m. The design report was finished in January 1997 and the field measurements were performed during the commissioning in January 1998. The major design specifications of conveyor P2 are:Material CoalCapacity 770t/h density 850kg/m surcharge angle 20Belt ST 800 N/mm800mm wideMotors 2 315 kW dual drivearrangement at head.Fig. Profile for P2 conveyor3. Computational Design ToolsSteady state and dynamic analysis methods were used to determine belt power, tension levels, and starting and stopping control methodologies. For steady state analysis the belt is assumed to act as a rigid (inelastic) body. The dynamic analysis uses a two dimensional wave theory to determine the time dependent propagation of tension waves through the belt. For dynamic analysis, the belt is divided into a series of elements containing elastic springs, dashpots, and discrete masses, see Fig. 3. The symbols used in that figure are given in 3. Rheological laws determine the interactions between these elements. Large amplitude tension waves, sometimes referred to as shock waves, and large local belt displacements can only be resolved using dynamic analysis. Steady state analysis produces the running belt tensions and power consumption for all material loading conditions and temperature variations. A computer program, tradenamed BELTSTAT, is used to analyze the steady-state design. Dynamic analysis produces the belt tension and the power consumption during non-stationary operation of the belt conveyor, like starting and stopping. Dynamic analysis is performed with a computer program tradenamed BELTFLEX. Dynamic analysis is used to:a. Simulate all motor and brake (if any) starting and stopping control functions and integrate their independent control methods with the belts elastic response:b. Develop control strategies and dynamic tuning methods (if required) to limit variations in belt tension and displacement within acceptable levels.c. Analyze and control the cause and effect resulting from what if operation scenarios such as drive and brake malfunctions.Fig.3 Example of a finite element representation of the belt conveyor and the belt4. Design SpecificationsThe company that designs a long belt conveyor system may not manufacture it. If designer and manufacturer are the same, the client often contracts a consultant to audit their work. Either the designer or the consultant may request field measurements. The main reasons for field measurements are to confirm that a system has been built in accordance with the design specifications and performs as predicted by the designers. The design report is used as the basis for comparison of the field measurements to the design specifications. Typical specifications made in a design report include:1. Material: tonnage, density and surcharge angle.2. Belt: width, strength, cover thickness, mass, Youngs modulus, speed, trough configuration.3. Drive assembly: power rating, nertias, number of drives, locations, efficiencies, gear box ratios4. Holdbacks: size, number, location5. Flywheels: size, number, location6. Take-up system: location, required belt line tension at take-up pulley, total required take-up displacement7. Idlers: idler spacing, roll sizes, applied loads, quantities8. Pulleys: arrangement, sizes and belt line tension at pulley locations9. Curves: sizes, belt stresses in curves, rift-off analysis10. Belt flap analysis11. Starting control12. Stopping control, including sequential regulation between connecting conveyors.Today, clients may request the supplier of a long belt conveyor system to guarantee that the system can be built at minimum capital and operational cost. They may also request a specification of the efficiency to transport the material at the design tonnage over the projected route and the maximum replacement rate of system components, such as idlers and belting. It should therefore be realized that the values of the system parameters, as given in a design report, are design values. These values may differ from the expected values as follow from the design calculations. The margin between the design and the expected values depends on the accuracy of the computational design tools, their input parameters, and the experience of the supplier. A typical expected percentage between the design and the expected values of system parameters is 10%. This level of accuracy is rarely achieved in overland conveyor design due to inaccuracy of the computational design tools, which are referenced to common standards.5. Test Procedures & EquipmentMost major conveyor components such as drives, brakes, and take-up systems located at the head and tail of the system. Because of this, most of the measurements are conducted at these locations. Unfortunately, these are areas of severe voltage and current fluctuations, as well as heavy EMF influences. For these reasons, all of the data acquisition equipment used in the field must be extremely robust. The equipment has to be capable not only of withstanding large voltage fluctuations and transients, but also be reliable, portable, and extremely noise immune.The following is a brief introduction to some of the equipment and methods used by CDI to acquire data for large overland conveyor systems. When relevant, attention has been given to the accuracy of the measurement and/or equipment.5.1 Data Acquisition RecorderThe basis of all of the field equipment is the data acquisition recorder. This device digitizes the various transducer signals, which can then be recorded on a note-book computer. A single data acquisition recorder may be used simultaneously to record more than 50 signals.Sample rates depend on the rate at which the signal changes in time and the desired accuracy of the result. Typically, sample rates vary between 0.1Hz to 10 kHz. High sampling rates are for example required to adequately capture motor and brake torque transients, velocity changes caused by transient stress waves, take-up motion, motor contactor response, brake valve and caliper timing, etc. Low sampling rates are used for recording weight scale and temperature measurements.To ensure proper timing for each field test, all data recording units must be triggered or started simultaneously. Since overland conveyors often transverse vast terrain, this is difficult at best. If PLC signals are available at both ends of the conveyor, a push button trigger signal can be hardwired into the PLC. This signal can then be relayed to the other end of the conveyor and all data recorders started simultaneously. This typically results in less than a 50 ms delay. Other methods include a verbal countdown (if communications are available), or both users triggering at predefined intervals.Two types of testing methods can be preformed. The first is a static method. For this method all data recorders are triggered simultaneously. Data is recorded at a fixed sampling rate for a preset set time interval. For example, a 60-second test with a sampling rate of 10Hz may be used to capture a startup or shutdown of the conveyor system. Unfortunately this method requires prior knowledge that the conveyor is indeed starting or stopping and the data recorder must be triggered before the event occurs. Although high sampling rates may be required during starting and stopping of the conveyor, these rates are not desirable for long term testing. The drawback of this method is the enormous amount of data that may be recorded due to high sample rates and long time intervals. The second method, which solves this problem, is a dynamic testing method which allows high sampling rates during transition periods and low sampling rates during steady state and shut-down periods. For this method, the data recorders are set to sample at the highest sampling rate desired. They are then all triggered simultaneously. After a specified time interval, say 500 seconds, the recorded data is analyzed. If the velocity of the conveyor has changed significantly, (the conveyor is started or stopped) then the data in this interval is saved to a time stamped file. If the velocity has not changed (the conveyor is either not moving or at steady state) then the power, temperature, and/or other steady state quantities can be time averaged and saved to a Separate data file. This method is far more complicated than the static test method, but it allows long term testing to be performed without any user intervention. It also gives the engineer the ability to capture unexpected conveyor shutdowns.5.2 Conveyor Belt VelocityOne of the most fundamental of all field measurements is that of belt velocity. Not only is this measurement necessary to confirm that the conveyor is indeed operating at its design speed, but more importantly to verify the starting and stopping dynamics of the overall conveyor system. Currently, the two most popular methods for determining conveyor velocity are by using either a magnetic pickup sensor or an optical encoder.Magnetic pickups require a rotating metal plate or gear tooth from which they received a pick signal or pulse. These devices may have as few as 1-32 pulses per-revolution. Although the errors produced from these devices may be acceptable at steady state velocity, their accuracy is severely diminished at low speeds. Since velocity is often used as a feedback signal to the PLC when starting and stopping the conveyor these errors may be significant. For example, a magnetic pickup device with only 16 pulses per-revolution, mounted on an 1,800mm diameter pulley rotating at 5.6rad/s (belt speed is 1 m/s), will only produce 1 pulse every 350 ms. Optical encoders on the other hand use an etched glass disk, which is rotated through a photoelectric diode. These devices can easily contain over 2,000 pulses per revolution. For the example above, an optical encoder and corresponding tachometer mounted on the same system would produce 1 pulse every 3 ms. Furthermore, unlike magnetic pickups, optical encoders can output a dual quadrature signal, resulting in doubling the signal count per revolution. This provides higher noise rejection, the ability to infer the rotational direction, and a more accurate signal.Fig.4 Velocity Encoder and wheelA typical optical encoder assembly is shown in Fig. 4. An optical encoder and wheel assembly is mounted on a movable aluminum arm and fixed to the structure. Fig.5 Two encoders mounted on a brake pulley to observe potential belt slipVelocity encoders can be used in conjunction with one another as shown in Fig. 5. Here two velocity encoder units are used to measure possible belt slippage. One unit is mounted on the belt, and measures the actual (angular) belt speed. The other unit is mounted on the pulley lagging to measure the (angular) pulley speed. Any velocity difference between these two, taking into account the difference in radii, is an indication of belt slip (also see Section 6.3).5.3 Conveyor Power & Motor TorqueAccurate power measurements must be taken to verify the outcome of the steady state calculations, confirm that a sufficient amount of power has been installed, and identify the accuracy of the design. There are three common methods for measuring conveyor power. The first method is to use a power transducer (watt meter). A power transducer measures the current and voltage going into a drive system. This is then converted to a motor power. Unfortunately, the power measured in this manner includes electrical and mechanical losses in the motor, gearbox, fluid coupling, and/or other losses. An engineering guess must there-fore be made as to the exact losses of each of these components to determine the actual power consumed by the conveyor belt itself. The second method is to measure the motor RPM, and use this in conjunction with a motor slip power curve. This method however, is only applicable for specific drive types. Further-more, since this method includes the losses from the gearbox, fluid couplings, and other intermediate equipment, the conveyor power at the drive pulley low speed shaft cannot be directly determined.Fig.6 Strain gauge assembly used to measure shaft torque and conveyor powerThe third method for measuring conveyor power is by directly measuring the strain in the drive pulley shaft caused by the applied torque. This deformation can then be directly converted to drive torque. The torque is then multiplied by the conveyors velocity and divided by the pulleys radius to obtain the conveyors power. Fig. 6 shows the equipment necessary for acquiring accurate torque measurements. Strain gauges are mounted on the gearbox and/or pulley shaft. Due to the shafts rotation, wires cannot be directly connected from the data acquisition equipment to these gauges. Instead, either slip rings or wireless methods must be used. Slip rings are typically unacceptable for these types of applications because they produce excessive noise and the physical geometry of the system often does not allow their installation. Wireless methods have proven to be acceptable and very reliable. A small battery powered transmitter and transmitting antenna is mounted on the rotating shaft. The transmitter functions as both the power supply and amplifier for the strain gauge bridge mounted on the shaft. It then converts the strain gauge output into a 5kHz pulse modulated FM signal. This signal is transmitted to a stationary receiving antenna fixed around the outside of the shaft. The receiving antenna is connected to a receiver unit, which converts the FM signal back into a DC voltage. The data acquisition recorder then acquires this voltage. Fig. 7 shows a typical result of torque measurements from a wound rotor motor startup. The holdback and steady state torques are shown. Furthermore, each of the 25 resistor steps and their corresponding firing sequence can be identified.Fig.7 Torque measurement for a wound rotor motor startupAn interesting side result can be obtained by performing a Fast Fourier Transformation (FFT) of the steady state torque signals. From the raw torque signal a vast amount of information about the system can be determined.Fig. 8 shows the system configuration and results from an FET performed on a steady state torque signal. This system consisted of a squirrel cage motor, fluid coupling, gearbox, and drive pulley. A strain-gauge bridge was mounted on the shaft between the gearbox and drive pulley. The x-axis of Fig. 8 has been converted from a frequency spectrum to an equivalent shaft RPM speed. Due to a small misalignment in the drive system, the high frequency torque components of the fluid coupling were transmitted, through the gearbox to the pulley shaft. These components are shown in Fig. 8. These frequency components allowed the slip across the fluid couplings to be calculated. Furthermore, by knowing the motor RPM, the torque could be back calculated from a motor slip curve. This torque agreed within 3% of the actual measured torque. Additionally, the pulley shaft RPM was clearly present, and the conveyor velocity could be calculated. This agreed within 5% of the measured velocity. The remaining frequency spikes correlate to the gearbox reduction steps and their higher harmonics.Fig.8 Fast Fourier Transform of a raw torque signal5.4 Take-Up TensionFrom the results of torque measurements, the tension differential over the drive pulley is known. To obtain the actual tension values one of the two tensions has to be known as a reference. The most convenient tension to measure is the take-up tension. This tension is later used as a reference tension. The take-up tension is usually measured using a load cell installed in the cable arrangement of the take-up system. If possible a pre-made and calibrated load cell is used. In that case the error made in the tension measurement is less than 1%. Otherwise, the take-up structure itself may be strain-gauged and used as a load cell. Fig. 9 shows a load cell installed at the terminating end of the gravity take-up cables of the Muja P2 Conveyor.Fig.9 Load cell installed on gravity take-up system5.5 Take-Up DisplacementTake-up displacement is measured to verify its theoretical prediction and confirm the take-up displacement requirements.Fig.10 Take-up Displacement MeasurementTake-up displacement is measured with the same equipment used for measuring conveyor velocity. In this case however, the dual quadrature pulse is counted in time to provide an equivalent displacement instead of velocity. A typical displacement apparatus mounted on a take-up sheave is shown in Fig. 10. The accuracy of the assembly is approximately 5mm over a 1,000mm displacement range. This is more than 99.5% and well within the desired precision5.6 TemperatureAmbient temperature variations can significantly alter the visco-elastic properties of the conveyor belts cover rubber compound. These variations are usually given as design parameter and accounted for in the steady state analyses. Temperature variations affect the rubber deformation as it travels over the idlers, which in turn changes the power consumption of the conveyor. Low temperatures can also increase the idler bearing drag. When elevation changes of a conveyor are significant, temperature measurements are acquired at both the head and tail of the conveyor system. Temperature measurements are continuously acquired using a thermocouple and recorded by the data acquisition recorder during each test. In some cases both summer and winter testing must be conducted to confirm the power fluctuations with temperature of the conveyor system.5.7 Brake TorqueBrake torque measurements are required to verify that the brake system is performing in accordance to the manufacturer and design specifications.Fig.11 Disk Brake Torque MeasurementsBrake torque is measured using the same techniques as motor torque. A typical arrangement for measuring brake torque on a decline conveyor system is shown Fig. 11. For this system the brake is located between the output shaft of the gearbox and the conveyors tail pulley. Although only one side of the disk brake is shown, both sides have been instrumented with strain-gauge bridges.Fig.12 Brake disk torque results and measurement errorFig. 12 shows the brake torque results from an operational stop of the system described above and shown in Fig. 11. The stop is initiated 6 seconds into the test. Prior to that time, the conveyor is running at steady state conditions where the regenerative power of the conveyor can be calculated. Note that the two torque signals (which are on two different shafts with different shaft diameters and wall thickness) are within 2% variation of each other. After 6 seconds, the brake is applied. Part of the brake torque is utilized to stop the conveyor while the rest is used to stop the motor and flywheel. Strain gauge bridges on both sides of the brake disk allow each torque component to be determined separately. These components can then be added together to obtain the total brake torque.The overall error in the torque measurement is determined by the errors made in the speed measurements (1%), the torque measurement (2%) and the parameters of the shaft material (2%). This results in an overall error of less than 5%.5.8 Weight ScaleIt is important that the exact belt load is known to enable an accurate comparison between the results of the steady state and dynamic analyses, and the results of the measurements. Precise weight scale readings must therefore be recorded. Fortunately, most long overland conveyors already have calibrated weight scales installed during commissioning. In this case the signal and appropriate scaling factors can be taken directly from the PLC. It is important to realize that when acquiring measurements, the bulk material load on the belt is not the same as the current weight scale readings. In order to determine the correct loading profile on the belt, both weight scale and velocity must have been recorded for a certain period prior to the test. The length of this period must be at least the conveyor length divided by the steady state velocity. The loading values can then be integrated over the entire length of the convey, or to determine the actual belt load.6. Muja: Theory & PracticeIn this section a comparison will be made between the theoretical prediction and the results of the field measurements as acquired for Muja conveyor P2.6.1 Power ConsumptionFig.13 Comparison between measured and predicted power consumption of conveyor P2As already mentioned in Section 3, clients may request a specification of the minimum efficiency, for example quantified in terms of maximum kW-hr/ton/km, to transport the bulk solid material at the design specifications over the projected route. For long overland conveyor systems, the transport efficiency is mainly determined by the indentation rolling resistance 1. It is therefore very important that design tools are available to accurately calculate this resistance. Some of the design tools used by CDI have previously been described before in 2 and 3, and the applicable theory in 4.Fig. 13 shows a comparison between the measured and the predicted power consumption of the Premier Muja belt conveyor P2. It also shows the expected power consumption as determined by the conventional CEMA method 5. Commissioning was performed during the summer and the figure is therefore only valid for these conditions (27 degrees centigrade). The dash-dotted line in Fig. 13 shows the design values of the power consumption, as given in the design report issued in 1997. These numbers are conservative as explained in Section 4. CDIs criterion is to provide a 10% reserve over the expected power draw for the long term changes to belt, structural alignment, and load sharing drift (pulley wear etc.). The solid line reflects the expected values of the power consumption as yielded from the design calculations. The maximum difference in power between the design power and the expected power is about25kW (less than 10%). The average deviation between the expected and the actual measured values of the power is 4.3%. This falls within the accuracy of the measurements. The average deviation between the design values and the measured values is less than 15%.The required drive power of a conveyor is determined by the sum of the total frictional resistances and the total material lift. The frictional resistances include hysteresis losses, which can be considered as a viscous (velocity dependent) friction component. It does not suffice to look just at the maximum required drive power to evaluate whether or not the power consumption of a conveyor system is reasonable. The best method to compare the power consumption of different systems is to compare their transport efficiencies.There are a number of methods to corn-care transport efficiencies. The first and most widely applied method is to compare equivalent friction factors such as the DIN f factor. For P2 that factor is 0.013 with the fully loaded belt (770t/h). An advantage of using an equivalent friction factor is that it can also be determined for an empty belt. A drawback to using an equivalent friction factor is that it is not a pure efficiency number. It takes into account the mass of the belt, reduced mass of the rollers and the mass of the transported material. However, in a pure efficiency number, only the mass of the transported material is taken into account. The second method is to compare transportation cost, either in kW-hr/ton/km or in $/ton/km. For the Muja conveyor P2, the transportation cost for a fully loaded belt is 0.072 kW-hr/ton/km. The advantage of using the transportation cost is that this number is widely used for management purposes. The disadvantage of using the transportation cost is that it does not directly reflect the efficiency of a system. The third and most pure method is to compare transport efficiency numbers. The transport efficiency number is the ratio between the drive power required to overcome frictional losses (neglecting drive efficiency and power loss/gain required to raise/lower the material) and the transport work. The transport work is defined as the multiplication of the total transported quantity of bulk solid material and the average transport velocity. For the Muja P2 conveyor the transport efficiency number is 0.025. This number can, for example, be used to compare the transport efficiencies between a belt conveyor and a truck system. The disadvantage is that it depends on the transported quantity of material and thus cannot be determined for an empty conveyor.6.2 Wave Propagation SpeedThe belts elastic properties and the mass of the belt, idlers and bulk material mainly determine the dynamic behavior of long belt conveyor systems. The speed at which stress-waves travel through the belt must be known to determine appropriate starting and stopping procedures. Two wave speeds can be distinguished: the longitudinal wave speed and the propagation speed of transverse waves 6. The longitudinal wave speed is determined by the belts Youngs modulus; the cross-sectional area of the belt, the mass of the belt and bulk material, and the reduced mass of rollers.The expected longitudinal wave speed in a belt can be theoretically calculated if the belt parameters are known 6. The actual wave speed can be determined from measuring the time it takes a tension wave to travel from the head to the tail of the conveyor. The most suitable measurement to determine the wave speed is to measure the belt speed at the head and at the tail of the conveyor during an emergency stop. During an emergency stop the drives are switched off, the belt tension at the head drops considerably and a sudden change in belt speed at the head occurs.Fig.14 Belt speed at the head of the conveyor. The belt is empty.Fig. 14 shows the velocity of the belt at the head of the conveyor as calculated by BELTFLEX, and as measured on site. At t=0s the drives are switched off and the belt speed drops down from 4.4m/s to 3.5m/s. Fig. 15 shows the belt speed at the tail of the conveyor. At t=0 the tail brake is applied which causes a small decrease in belt speed. At t = 3.1 s the tension wave coming from the head arrives at the tail of the conveyor and the belt speed drops down to 2.8m/s. This time lag is 3.1seconds. Dividing the length of the 6.1km conveyor by the time lag, yields the wave speed. In this case the wave speed is 1968 m/s which is a representative number for an empty steel cord belt. This wave speed is used as a referenceFig.15 Belt speed at the tail of the conveyor. The belt is empty and a tail brake is appliedUsing the (measured) belts Youngs modulus of 5154 N/mm, and the belt density of 1307 kg/m, a theoretical longitudinal wave speed of 1985 m/s can be calculated. This is within 1% of the measured wave speed. When calculating the wave speed for a loaded belt, a part of the reduced mass of the rollers and the belt load has to be taken into account. As the belt is loaded the wave speed will decrease. Fig. 16 shows the decrease in wave speed as a ratio of the actual wave speed (as determined from the measurements) and the reference wave speed. The upper line shows the theoretical wave speed decay only taking into account the mass of the material and belt. The lower line shows the wave speed decay taking also the reduced mass of the rollers into account. For both lines 100% of the material mass is taken into account. The dots in Fig. 16 show the wave speed ratios as determined from the actual field measurements at different tonnages. It can be observed that the contribution of the reduced mass of the rollers becomes more prevalent as the belt load increases. The slip between the belt and the idler rolls, which may occur during passage of a transient stress wave, decreases with increasing belt load.Fig.16 Decrease in wave speed ratio with increasing belt load. The belt is loaded at the design tonnage at a belt load of 100%.6.3 Dynamic TuningThe process of determining the settings of the drives, brakes and/or flywheels is called dynamic tuning of the system. A 10kNm brake is applied during an emergency stop to both limit the stopping time and prevent excessive belt sag in the carry strand of the conveyors W-section, also see Fig. 2. The tension at the head of the conveyor quickly drops to the pretension when the drives are switched off. This tension drop generates a negative tension wave in the carry strand traveling from the head of the conveyor, to the tail of the conveyor, and to the drive/take-up station lowering the tension in the whole belt. If the brake is not applied, the conveyor will drift to a stop and the tensions in the W-section of the belt will fall below an acceptable level, yielding more than 5% of belt sag. A tail brake is required to increase the belt tension during an emergency shut down. The carry strand tension is increased as soon as the brake is applied generating a positive tension wave travelling from the brake pulley towards the head of the conveyor increasing the tension in the carry strand of the belt. If the brake is located at the tail, the positive tension wave arrives in time at the W-section to counteract the negative tension wave coming from the drive stat
温馨提示:
1: 本站所有资源如无特殊说明,都需要本地电脑安装OFFICE2007和PDF阅读器。图纸软件为CAD,CAXA,PROE,UG,SolidWorks等.压缩文件请下载最新的WinRAR软件解压。
2: 本站的文档不包含任何第三方提供的附件图纸等,如果需要附件,请联系上传者。文件的所有权益归上传用户所有。
3.本站RAR压缩包中若带图纸,网页内容里面会有图纸预览,若没有图纸预览就没有图纸。
4. 未经权益所有人同意不得将文件中的内容挪作商业或盈利用途。
5. 人人文库网仅提供信息存储空间,仅对用户上传内容的表现方式做保护处理,对用户上传分享的文档内容本身不做任何修改或编辑,并不能对任何下载内容负责。
6. 下载文件中如有侵权或不适当内容,请与我们联系,我们立即纠正。
7. 本站不保证下载资源的准确性、安全性和完整性, 同时也不承担用户因使用这些下载资源对自己和他人造成任何形式的伤害或损失。
提示  人人文库网所有资源均是用户自行上传分享,仅供网友学习交流,未经上传用户书面授权,请勿作他用。
关于本文
本文标题:菌类培养袋分离机构设计【开题+翻译+实习】【3张图纸】【优秀】
链接地址:https://www.renrendoc.com/p-422836.html

官方联系方式

2:不支持迅雷下载,请使用浏览器下载   
3:不支持QQ浏览器下载,请用其他浏览器   
4:下载后的文档和图纸-无水印   
5:文档经过压缩,下载后原文更清晰   
关于我们 - 网站声明 - 网站地图 - 资源地图 - 友情链接 - 网站客服 - 联系我们

网站客服QQ:2881952447     

copyright@ 2020-2025  renrendoc.com 人人文库版权所有   联系电话:400-852-1180

备案号:蜀ICP备2022000484号-2       经营许可证: 川B2-20220663       公网安备川公网安备: 51019002004831号

本站为文档C2C交易模式,即用户上传的文档直接被用户下载,本站只是中间服务平台,本站所有文档下载所得的收益归上传人(含作者)所有。人人文库网仅提供信息存储空间,仅对用户上传内容的表现方式做保护处理,对上载内容本身不做任何修改或编辑。若文档所含内容侵犯了您的版权或隐私,请立即通知人人文库网,我们立即给予删除!