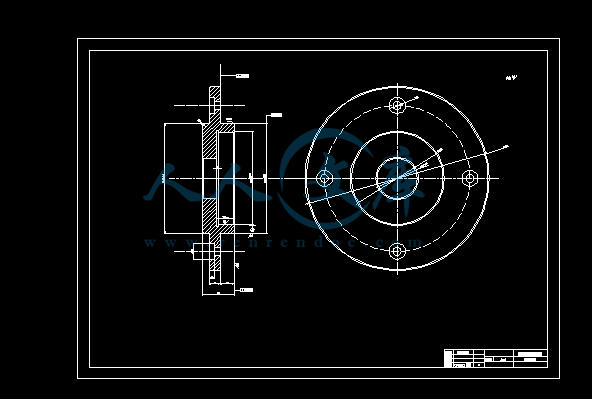
轴承盖A1.dwg
轴承盖A1.dwg

数控铣床Z轴进给系统设计【6张图纸】【优秀】

收藏

压缩包内文档预览:
预览图
编号:423438    类型:共享资源    大小:3.13MB    格式:RAR    上传时间:2015-04-08 上传人:上*** IP属地:江苏
39
积分
关 键 词:
数控铣床 进给系统 设计 图纸 Z轴进给系统 Z轴进给
资源描述:

数控铣床Z轴进给系统设计

说明书 42页20000字数+6张CAD图纸

轴承盖A1.dwg

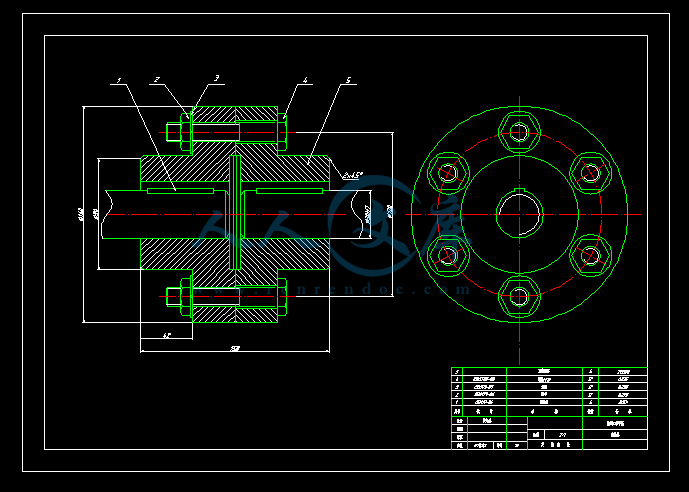
1联轴器A2.dwg

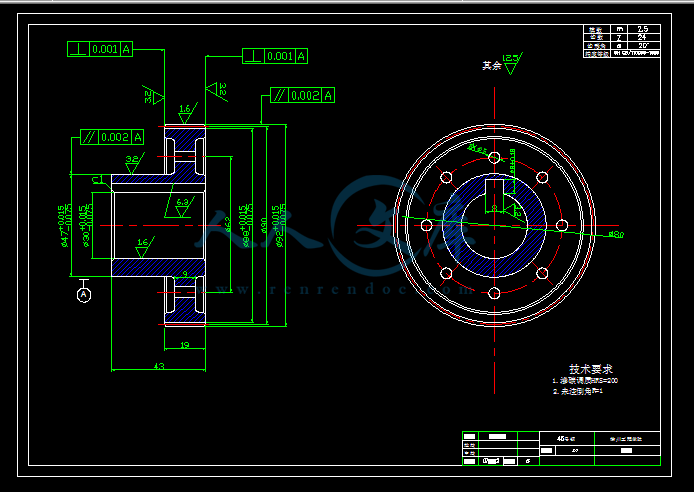
A2齿轮.dwg

Z轴进给运动装配图A0.dwg

主轴图零件.dwg

外文翻译--数控机床性能测试设备的开发和利用  中文版.doc

外文翻译--数控机床性能测试设备的开发和利用  英文版.pdf

客户资料--数控铣床Z轴进给系统设计

数控铣床Z轴进给系统设计论文.doc

数控铣床Z轴进给系统设计.txt

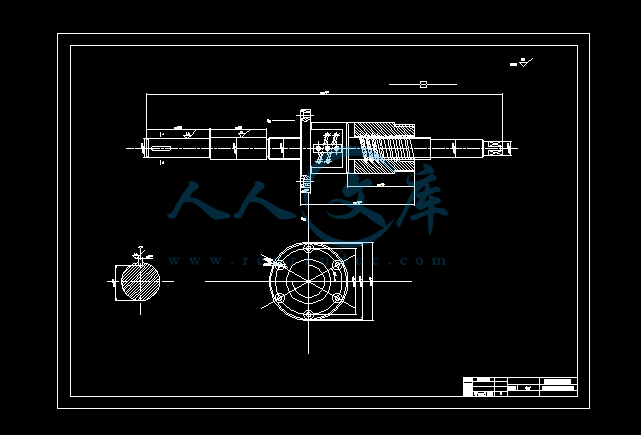
滚珠丝杠A1.dwg

论文.doc

数控铣床Z轴进给系统设计

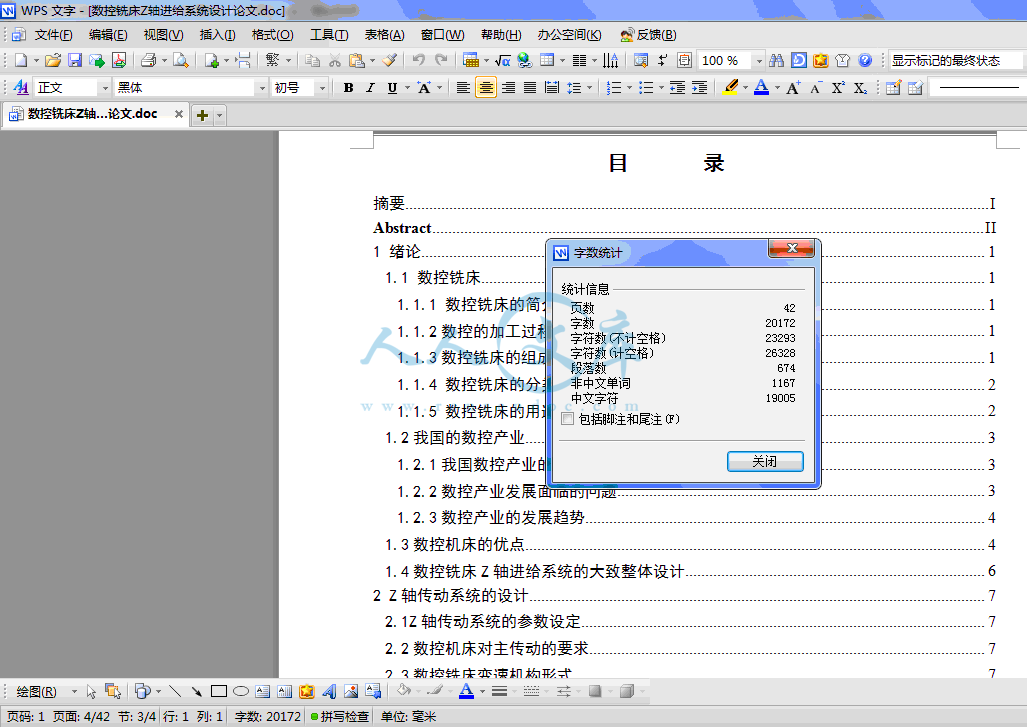
目       录

摘要I

AbstractII

1 绪论1

1.1 数控铣床1

1.1.1 数控铣床的简介1

1.1.2数控的加工过程1

1.1.3数控铣床的组成1

1.1.4 数控铣床的分类2

1.1.5 数控铣床的用途和工艺特点2

1.2我国的数控产业3

1.2.1我国数控产业的现状3

1.2.2数控产业发展面临的问题3

1.2.3数控产业的发展趋势4

1.3数控机床的优点4

1.4数控铣床Z轴进给系统的大致整体设计6

2 Z轴传动系统的设计7

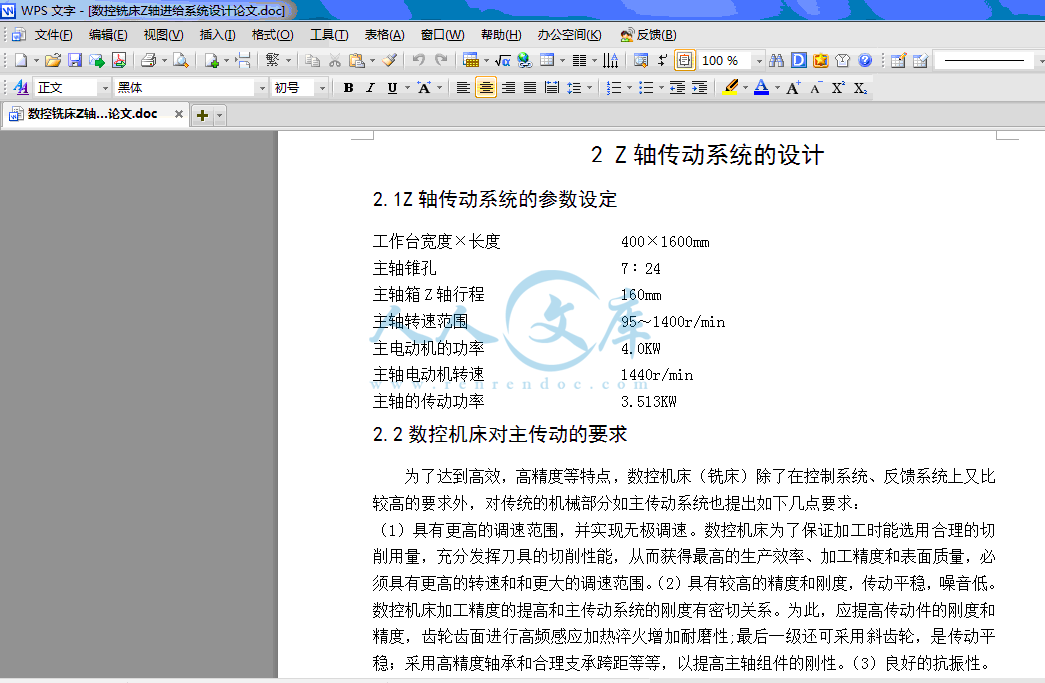
2.1Z轴传动系统的参数设定7

2.2数控机床对主传动的要求7

2.3数控铣床变速机构形式7

2.4主轴的设计8

2.4.1主轴材料的选择8

2.4.2主轴结构的确定8

2.4.3轴的校核计算9

2.5齿轮传动的设计计算12

2.5.1模数的估算:13

2.5.2齿轮分度圆直径的计算13

2.5.3齿轮宽度B的确定14

2.5.4齿轮其他参数的计算14

2.5.5齿轮的校核(接触疲劳强度):14

3 Z轴进给系统总体方案的设计15

3.1设计参数15

3.2工作原理15

3.3总体方案设计15

3.3.1 数控系统的选择15

3.3.2传动机构的选择16

3.3.3联轴器选择16

4 主要零部件的计算与选用18

4.1Z轴工作载荷分析18

4.2 Z轴工作载荷计算18

4.3滚珠丝杠螺母副的计算与选用18

4.3.1丝杠导程的确定18

4.3.2动载荷C计算19

4.3.3效率计算20

4.3.4滚珠丝杠的精度选择20

4.3.5滚珠丝杠的制动20

4.4滚珠丝杠螺母副支承的选择21

4.5滚珠丝杠螺母副的间隙消除与预紧22

4.6轴承的计算与选用22

4.6.1轴承初选22

4.6.2轴承的计算23

4.6.3确定轴承的规格型号24

4.7传动系统的刚度计算24

4.7.1丝杠拉压刚度KT24

4.7.2滚珠丝杠螺母副的轴向接触刚度KN25

4.7.3支承轴承的轴向刚度KH25

4.7.4丝杠传动的综合拉压刚度K25

4.8伺服电动机的选择计算25

4.8.1确定步进电动机的类型25

4.8.2确定脉冲当量26

4.8.3最大静态转矩的选择26

4.9负载转动惯量的计算26

4.9.1工作台折算到丝杠上的转动惯量27

4.9.2丝杠折算到电动机的转动惯量27

4.9.3传动系统折算到电机轴上的总转动惯量27

4.10负载力矩的计算27

4.10.1计算折算到电动机主轴上切削负载力矩27

4.10.2计算折算到电动机上的摩擦负载力矩27

4.10.3计算附加负载力矩28

4.10.4加速力矩28

4.10.5计算空载时的快进力矩28

4.10.6计算切削时的工进力矩28

4.10.7计算空载启动力矩28

4.10.8确定步进电动机的最大静转矩29

4.11导轨的选择29

4.11.1导轨的介绍29

4.11.2导轨的参数选取30

4.11.3导轨的间隙调整31

4.11.4导轨材料与热处理32

5主要零件的校核33

5.1 滚珠丝杠螺母副的校核33

5.1.1 滚珠丝杠螺母副临界转速的校核33

5.1.2滚珠丝杠螺母副寿命的校核33

结论34

致谢35

参考文献36

1 绪论

1.1 数控铣床

1.1.1 数控铣床的简介

科学技术的发展以及世界先进制造技术的兴起和不断成熟,对数控加工技术提出了更高的要求;超高速切削、超精密加工等技术的应用,对数控机床的数控系统、伺服性能、主轴驱动、机床结构等提山了更高的性能指标;FMS的迅速发展和CIMS的不断成熟,又将对数控机的可靠性、通信功能、人工智能和自适应控制等技术提出更高的要求。随着微电子和计算机技术的发展,数控系统的性能日益完盖,数控技术的应用领域日益扩大。

   数控铣床是在数控加丁中心领域中最具代表性的一种典型机床,在数控机床中所占的比率最大,数控加工中心、柔性制造单元等都是数控铣床基础上派生或发展起来的。它具有功能性强、加工范围广、工艺较复杂等特点,主要用于各种复杂的平面、轮廓、曲面等零件的铣削加工,同时还可以进行钻、扩、镗、攻螺纹等加工,在航空航天、汽车制造、机械加工和模具制造业中应用非常广泛。

1.1.2数控的加工过程

数控车床加工零件的主要过程主要包括一下内容:

(1)根据被加工零件的图样与工作方案,用规定的代码与程序格式,将刀具的移动轨迹、加工工艺过程、工艺参数、切削用量等编写成数控系统能够识别的指令形式,即编写加工程序。

(2)将所编写的加工程序输入数控装置。

(3)数控装置对输入的程序(代码)进行译码、运算处理,并像各坐标轴的伺服驱动装置和辅助功能控制装置发出相应的控制信号,以控制车床各部件的运动。

(4)在运动过程中,数控系统需随时检测车床坐标轴的位置、行程开关的状态等,并与程序的要求相比较,以决定下一步动作,直到加工出合格的零件。

(5)操作者随时对车床的加工情况、工作状态进行观察和检查,必要时还需要对车床动作和加工程序进行调整,以保证车床安全、可靠的运行。

1.1.3数控铣床的组成

数控铣床一般由数控系统、机床基础部件、主轴箱、进给伺服系统及辅助装置等几大部分组成。

(1)数控系统

   数控系统是机床运动控制的中心,通常数控铣床都配有高性能、高精度、集成软件的微机数控系统,具有直线插补、圆弧插补、刀具补偿、固定循环、用户宏程序等功能,能完成绝大多数的基本铣削以及镗削、钻削、攻螺纹等循环加工。

(2)机床基础部件

   通常是指底坐、立柱、工作台、横梁等,是整个机床的基础和框架。

(3)主轴箱

   包括主轴箱和主轴传动系统,用于装刀具并带动刀具旋转、主传动大多采用专用的无级调速电动机驱动。

(4)进给伺服系统

   由进给电动机和进给执行机构组成,按照程序设定的进给速度实现刀具和工件之间的相对运动,其主轴垂直方向进给运动及工作台的横向和纵向进给运动均由各自的交流伺服电机来驱动。

(5)辅助装置

   包括液压、气动、润滑、冷却系统和排屑、防护等装置。

内容简介:
数控机床性能测试设备的开发和利用温玉宝自动化工程的教授,国立虎尾技术学院,台湾,云林,,虎尾632地址:64文化路,国家技术虎尾,云林,台湾,中华民国虎尾研究所摘要数控机床测试性能装置也被开发出来。其采用一种小半径收缩,检验装置的动态性能的数控机床。这种设备由激光二极管和象限传感器组成。几何误差检测的长半径数控机床,采用线性控制装置。光学编码器的轮廓系统也被展现出来。本文对实验工作进行了概述。关键词:造型;数控机床;几何误差;传感器;光学规模;象限;平面编码器1、概述布赖恩在1982年开发的第一个球杆系统的线性控制测试。然而,在这个系统中,其不确定度高是由于两个主球和磁性插座没有给出精确的轮廓半径摩擦。纳普在1983年曾使用标准圆盘比较实验表的工具和二维探针的工作情况。卡文(1985)、井原.凯瑞(1986)、中津(1987)都分别为校准三坐标测量机和数控机床的球形系统提供了一些办法。纳普(1986、1988)描述过借助粘滑等办法来减少失误的理论规则。本人在1992年提供了一种方法来诊断的线性误差,调整控制器的参数优化数控机床性能的测试工具。J.C简格在1994年和克里斯托弗描述激光弹杆系统通过引导一个纤维有激光干涉仪。本人在2001年通过验证并开发的数控车床的联动应用,收紧误差的办法,弥补了这一缺憾。上述造型系统提供了通用的线性控制测试。由于高额的测量装置费,他们仍然不能提供适当的线性控制系统因不同的目的。因此,在本文中,一些简单和低成本的线性控制系统的开发目的。 他们进对此进行总结和描绘如下: 1、激光二极管和轮廓的象限传感器系统的轮廓半径小(小于4毫米的轮廓半径)。 2、视神经规模大轮廓半径轮廓和体积误差的测试系统(高达300毫米的轮廓半径)。3、视神经规模的体积轮廓误差测试系统。4、自我支持的球的轮廓切割风云变幻的考验下杆系。2、激光二极管与象限仪轮廓传感器系统(QSCS)图1描述了激光二极管和象限传感器测量系统,激光二极管组成了一个光学镜头,一个盾牌,一个象限传感器,提出一个信号,一个A/ D接口卡和PC机。象限仪传感器输出电压4通道,而激光灯投射在上面。由于该象限探测器尺寸的限制,最多只有4毫米轮廓半径可用。然而,有很好的检查了数控机床的动态性能不够。图1机器的性能测试工具象限传感器图2对激光二极管的工作原理和象限传感器如图2所示,激光二极管,提供激光灯和光的重点和象限仪投影。象限仪输出的四信道在长期的电压信号。从传感器上的象限投影点,在X轴和Y轴位置可以得到。让弗吉尼亚州,VB的,VC和VD的代表传感器的输出电压。图3显示了校准图,获得在X轴和Y轴的位置。图3在一个象限传感器轴校准图图4依据于FANUC系列的奥姆数控器的立式铣床的测试结果本实验测试使用QSCS。如图4所示,象限仪传感器的工作频率范围为6mm6mm校准后。Fanuc系列数控立式铣床奥姆控制器进行了测试。轮廓进给速度的选择10,2100和3200毫米/分钟。2mm的圆形轮廓半径设置为三个运行为顺时针和逆时针。在实际测试中,当上轮廓半径降低进给速度增加,每个3运行的重复性非常好。在3200毫米/分钟进给速度时,半径误差为-0.7mm的。此外,在图4轮廓误差结果显示45 椭圆路径。所有这些在图4轮廓误差在发那科公司1990年提供的手册中有介绍。3、尺度的光电测量系统在本节光学测量系统的开发规模。基本上,该系统采用的轮廓在数控机床的考验。然而,采用这种系统体积误差测试进行了研究。然后,运用这种方法来测试系统的垂直度误差为代表。3.1视神经规模轮廓测量系统的测试图5显示视神经规模测量数控机床性能测试系统。一个光学规模是固定在支撑块。阅读头为指导的指导栏和感动的感动吧。一个线性轴承支承块之间的固定和移动栏,而另一种是光学读取头之间的指导和酒吧固定的。一个主球是连接到一个磁棒,它是在数控机床主轴固定,而另一主球和磁棒磁性元素是一个基础,这是在测试数控机床工作台设置固定的。图5.光学测量系统的结构在检测过程中,两个主球之间的相对位移进行采样。对于一个圆形轮廓测试,轮廓中心设置在表,而在两轴机床,同时提出主轴球中心。该议案将导致视神经轮廓规模沿着视神经读取头。因此,样品可通过计数器和发送到PC接口卡。此外,软件是简单,记录并分析数据。图6在使用体积误差测试系统结构的光学测量4光电规模的体积测量系统误差试验根据数控机床定位测试ISO203- 2或ANSI B5的标准,一个简单的测试可以执行的位置,在一般情况下,由一个昂贵的激光干涉仪系统。对于不同的测量领域,不同的设置起坐是必要的。正如温玉宝以前的研究(2000年),一个球体体积误差可以进行杆系由一球。在这种制度下,只有位置的误差,球体的表面反弹,可由于该LVDT(线性可变差动变压器),这是在球杆系统采用工作范围的限制。总之,视觉尺度测量系统利用了两个测量系统的优点。1、在一个设定后,一个空心球的数控机床空间误差可以进行。2、这种光学尺度系统成本低。这是很容易操作。3、对于数控机床不同规模,不同范围的光学尺度总是可用的。图6显示了一个数控机床的空心球体的体积采样路径。在一成立,对视神经规模的连锁主球中心着手在被测试的数控机床体积中心。然后安排是可能的,即使间距采样,以确定采取的路径。例如,球被切成5架飞机。每架飞机是均匀地切成6线(360/60)。每个系列包括8(240mm/30mm= 8)个采样点。因此,在一个设置,注册240(5x6x8=240)可以采取抽样点。要测试的反弹和3x2运行需要的可重复性。因此,240x6= 1440运行采取采样点。这需要每个采样2秒。因此,需时约1(包括设定时间)小时进行这项工作图7的垂直度误差的YZ和ZX平面测试的测试安排在此试验安排在图7,水平XY平面轮廓进行。接着,用同样的设置和规模相同的光学测量系统,让主轴在Z向上移动,在距离(偏移)轴。第二个轮廓,然后执行测试。有了这个光学测量系统的规模,这是没有必要的联系,改变或设置,在此垂直测试了。如果没有错误存在相同的方形分析的初始设置,在两个轮廓测试错误(偏心)将对准。根据这项安排,第二个采样数据分析之前必须进行修改。因此 然后: 采样后用短环与长链和修改后的数据的原始样本数据分析了最小二乘拟合。两个单独分析初始设置为错误的垂直误差的计算使用。在ZX平面空间内有:在YZ平面空间内有:其中(X2-X1/offset)是第一个轮廓分析测试中心其中(Y2-Y1/offset)是第二轮廓分析测试中心销是测试后的第一个轮廓在Z轴移动距离4.1平面轮廓编码器装置的数控机床平面编码器的原理一个平面编码器系统,如雷尼绍RGX格板,已被开发,如半导体和电子制造设备等应用。该系统使用2的阅读读chegure图案在X和Y方向同时正交网格传感器头。具有良好的动态响应系统可以提供高达0.1米的分辨率定位。 图8显示了如何使用一个简单的平面轮廓编码器的测试安排。此平面式编码器提供定位在每个轴的二维轮廓信息。在测试过程中,平面上设置编码器的数控机床。该读数头是固定的数控机床主轴。计算机的计数卡通过一个软件可以读取采样数据。这种采样轮廓设备提供了以下功能。1、轮廓测试期间,在每个轴个别轮廓误差可以得到。这是分析和有用的轮廓误差补偿。2、上轮廓面积可高达为0.1微米的选择在此区域内至1微米至300毫米x 300毫米的决议,各种轮廓的路径可以安排。3、这是很容易设置和操作。图8 平面轮廓编码器测试4.2试验结果一个简单的轮廓上进行测试是一个与0M的立式数控机床Fanuc的控制器XY平面。结果显示上轮廓在20毫米半径可以达到ISO230 -1和230-2要求Fig.9.The逆时针和顺时针轮廓测试。从结果,绝对半径误差容易找到。对于一般的轮廓系统上,只给出了圆度。此外,在每个轴误差可以单独也可以找到,如果必要的。这对于分析的目的非常有用。图9具有平面编码器的轮廓结果5自助联动系统本部分,自动联动系统是制定了轮廓切削条件下测试的应用程序。建议的补充劳工计划示意图图10所示。该系统由一个高精度的参考领域牢固地安装在主轴,四棒,L型的固定部分,固定部分,磁性底座,旋转轴和非接触式传感器。碳纤维传感器连接包含一个非接触式传感器(涡流传感器)位于球体之间的参考。该传感器的输出代表了中心的距离变化范围为圆形轮廓,机器进行操作。额外的支持之间的固定部分和旋转轴的链接提供了整体联动将在水平面期间举行的考验。图10自助联动系统的轮廓结构5.1轮廓与切削条件下的测试补充劳工计划补充劳工计划是用于测试本在切割过程中,数控机床的动态性能。补充劳工计划,不仅可以用于测试下非数控机床切削状况,而且还可以扩展到在切割过程中测试的动态性能。它是为在处理测量的重要性。补充劳工计划是用来测试一个立式数控加工中心与Fanuc的有机质控制器(永贵- FV6000系列)的动态性能。测试条件如下: 1)、高速切割机(12毫米,SL4SE协钴2)、标本(SS41)3)、切割宽度12mm和切割深度为1mm4)、转速50(毫米/分),顺时针5)、主轴转速800r.p.m6)、轮廓半径一百三十五毫米7)、讨论与结论对于测试的目的不同,正确的测量工具应该被应用。本文系统提供四个轮廓。与同类软件和硬件成本低这些系统的应用提供了良好的解决方案。这些系统的功能,可以列出如下。1)、象限传感器系统提供短半径轮廓轮廓。动态误差可以检查系统成功。2)、光学测量系统规模提供长期的工作范围轮廓。因此,不论轮廓和体积的试验可安排在所提供的方法。空心球的该系统体积误差测试于一体化的成立为垂直度误差的方法进行了研究。3)、对于加工测量,自我支持的联动系统,制定了有/无切削条件轮廓测试。该系统验证了一个简单的模型和实验结果。总之,在这个文件中,提供的系统和测量方法是在数控机床不同的测试用途。致谢特别感谢国家科学委员会,台湾和中国共和国对这项工作给予的支持。 参考文献1 巴顿布莱恩.测量的机器和机床的简单方法.工程.第四卷.第2,P61-P69.1982年2 瓦特纳普.测试的机床和测量机及其关系到机器的错误立体的不确定性.机械工程研究所纪事.编号1,.P459-P464.1983年3 瓦特纳普.循环的三坐标测量机工具测试.工程.第三期,P115-P124.1983年4 华柿野.补偿的三维坐标测量机和双球杆测试评价误差向量分析.P1244-P1250.19855 年华柿野.井原华和井津.数控机床和运动误差及其来源诊断磁球用伸缩杆法.机械工程研究所通志.第36卷第1期.P337-P380.1987年6 华柿野.华井原关于数控机床(第一报告)运动精度研究-以测量和双球杆运动误差的测试评价的JSPE学报.P1193-P1198.1986年7 华柿野.井原华和井津.关于数控机床(第二报告)诊断运动误差源用双球杆测试运动精度研究.P1739-P1745.1986年8 瓦特纳普.循环试验数控机床的工业应用.杂志工业的生产工程.第10卷.第三期,P99-P100.1986年9 瓦特纳普.长度测量定位精度.机械工程研究所P511-P514.1988年10米巴尔德肯.计算机辅助评价的数控机床轮廓加工精度系统.P197-P203.1988年11米巴尔德肯.动态循环系统的优化使用,数控机床轮廓精度.第29届国际机械改进讨论会议.四月.1992年12约翰.格特和克里斯托弗.激光球栏:新的机床计量仪器精密工程仪器.1994年13温玉宝和刘长虹.球杆的应用系统和遗传算法的数控成形板条补偿的国际先进制造技术杂志第17卷,P189-P195.2001年14温玉宝和刘长虹核查和数控机床的体积和位置误差的评价.国际机床与制造P1899-1911.2000年THE DEVELOPMENT AND APPLICATION OF PERFORMANCE TESTING DEVICES FOR CNC MACHINE TOOLS Wenyuh Jywe Professor, Department of Automation Engineering, National Huwei Institute of Technology, Huwei, Yunlin, Taiwan, 632 Address: 64 Wenhua Road, National Huwei Institute of Technology Huwei, Yunlin, Taiwan, R.O.C Email: J.tw Abstract: The testing devices for performance testing on a CNC machine tool were developed. A small-radius contouring device was employed for checking the dynamic performance of a CNC machine tool. This device was composed of a laser diode and a quadrant sensor. For checking geometric error of a CNC machine tool, a long-radius contouring device was employed. The optic encoder contouring systems were also represented. Experimental work was carried out in the paper. Copyright2002IFAC Keywords: Contouring; Geometric error; CNC machine tool; Quadrant sensor; Optic scale measuring system; Planar encoder 1. INTRODUCTION J.B. Bryan (1982) developed the first ball bar system for the contouring test. However, in this system, the uncertainty is high due to the friction between the master balls and the magnetic sockets and no accurate contouring radius was given. Knapps system (1983,1983) used the circle comparison standard disc mounted on the tested table of the machine tool and the 2D-probe. Y. Kakinov (1985), Y. Kakino, Y Ihara, A.Kamei (1986) and Y. Kakinov, Y.Ihara and Y. Nakastsu (1987). Y.Kakino, Y. Ihara and Y.Nakastu (1986) provided some methods by using the ball bar system to calibrate a coordinate measuring machine and CNC machine tools. W. Knapp (1986,1988) described the rules to reduce the errors due to the stick-slip and others. M. Burdekin and J. Park (1988) modified the original ball bar system by employing a four-rod linkage. M. Burdekin and W. Y. Jywe (1992) provided a method to diagnose the contouring error and to adjust the parameters of the CNC controller to optimize the performance of the tested CNC machine tool. J.C.Ziegert and Chritopher (1994) described the laser ball bar system by guiding a fiber with a laser interferometer. Wenyuh Jywe (2001) provided the application of the developed linkage to verify the contouring error of a CNC lathe and also provided the method to compensate for the error. The above contouring systems provided the general purpose of a contouring test. With the high cost of the measuring device, they still cannot provide proper contouring systems for various purposes. Thus, in this paper, some simple and low cost contouring systems are developed individually for different test purposes. They are summarized and represented as followed: 1. The laser diode and the quadrant sensor contouring system for small radius contouring (less than 4 mm in the contouring radius). 2. The optic scale contouring system for large-radius contouring and for the volumetric error test (Up to 300 mm in the contouring radius). 3. The optic scale contouring system for the volumetric error test. 4. The self- supported ball bar system for contouring test under cutting situation. 2. THE LASER DIODE AND THE QUADRANT SENSOR CONTOURING SYSTEM (QSCS) Fig.1 describes the laser diode and quadrant sensor measuring system, composed of a laser diode, an optic lenses, a shield, a quadrant sensor, a signal propose, an A/D interface card and a PC. The quadrant sensor output 4 channels of voltages while the laser light is projected on it. Due to the limitation of the size of the quadrant detector, only up to 4 mm contouring radius is available. However, there is good enough for checking the dynamic performance of the CNC Copyright 2002 IFAC15th Triennial World Congress, Barcelona, Spain machine tool. Fig1 The principle the quadrant sensor for performance test of a machine tool AVBVCVDVXYDiodeLaser Fig2 The working principle of a laser-diode and a quadrant sensor As shown in Fig.2, The laser diode provides a laser light and the light is focused and projected on the quadrant. The quadrant outputs four channel signals in term of voltages. From the projected point on the quadrant sensor, the position in X-axis and in Y-axis can be obtained. Let VA, VB, VC and VD represent the output voltages of the sensor. Fig.3 shows the calibration diagram to obtain the positions in X-axis and in Y-axis. XXxBABAbDaVVVV+=+XDXbBABAVVVV+(a) YYYDCDCbDaVVVV+=+YDYbDCDCVVVV+(b) Fig3: The calibrating diagram of an axis of a quadrant sensor After the calibrating, the constants will be saved in be PC and be employed for the further applications. Fig.4 The test result on a CNC vertical milling machine with a FANUC- Series OM controller 3. 1The experimental tests by using QSCS As shown in Fig.4, the quadrant sensor working range is about 6mm6mm after the calibration. A CNC vertical milling machine with a FANUC series OM controller is tested. The contouring feed rate is selected at 10, 2100 and 3200 mm/min individually. A 2mm circular contouring radius is set for three runs for both clockwise and anti-clockwise. The repeatability for each 3 runs is very good in the actual test. The contouring radius reduces when feed rate increases. At a feed rate of 3200 mm/min, the radius error is about -0.7mm. Also, the contouring error result in Fig.4 shows a 45 ellipse path. All these contouring errors in Fig.4 are corresponding to those shown in the manual (1990) provided by Fanuc Co. 3.THE OPTIC SCALE MEASURING SYSTEM In this section an optic scale measuring system is developed. Basically, the system is employed for contouring test on a CNC machine tool. However, the volumetric error test of employing this system is also studied. Then the method to employ this system for squareness errors test is represented. 3.1The optic scale measuring system for the contouring test Fig.5 indicates the optic scale measuring system for CNC machine tool performance test. An optic scale is fixed on the supporting block. The reading head is guided by the guiding bar and moved by the moving bar. One linear bearing is fixed between the supporting block and the moving bar while the other one is fixed between the optic reading head and the guiding bar. One master ball is connected to a magnetic bar, which is fixed on the CNC machine tool spindle while the other master ball and magnetic bar element is fixed on a magnetic base, which is set on the testing CNC machine tool table. Fig.5 The structure of the optic measuring system During a test, the relative displacement between two master balls is sampled. For a circular contouring test, the contouring center is set at the ball center of the spindle while the table is moved in the two axes of the machine tool at the same time. The contouring motion causes the optic scale to move along the optic reading head. Therefore, the sample can be obtained and sent to the PC via a counter interface card. Furthermore, software is written to simple, record and to analyze the data. Fig.6 The structure of using the optic measuring system for volumetric error test 4.THE OPTIC SCALE MEASURING SYSTEM FOR THE VOLUMETRIC ERROR TEST According to ISO203-2 or ANSI B5 standard, for CNC machine tool positioning test, a simple position test can be executed, in general, by an expensive laser interferometer system. For different measuring areas, different setting-ups are necessary. As previous study by Wenyuh Jywe (2000), a sphere volumetric error can be carried out by a ball bar system. In that system, only the position error and backlash on the surface of the sphere can be obtained due to the limitation of the working range of the LVDT (Linear Variable Differential Transformer), which is employed on the ball bar system. In summary, the optic scale measuring system takes both advantages of the two measuring systems. 1. In one setting-up, a hollow spherical volumetric error of a CNC machine tool can be carried out. 2. The cost of this optic scale system is low. It is easy to operation. 3. For different sizes of CNC machine tools, different ranges of optic scales are always available. Fig. 6 shows the sampling path of the hollow sphere volume of a CNC machine tool. In one-setting up, the center of the master ball of the optic scale linkage is set about at the center of the volume of the tested CNC machine tool. Then possible even spacing arrangement is taken to identify the sampling path. For example, the sphere is cut into 5 planes. Each plane is evenly cut into 6 lines (360 /60 ). Each line includes 8 sampling points (240mm/30mm = 8). Thus in one setting-up 240 sampling points (5x6x8 = 240) can be taken. To test the backlash and the repeatability 3x2 runs are needed. Thus 240x6 runs = 1440 sampling points are taken. It takes 2 seconds for each sampling. Thus, it takes about one hour (including setting up time) to carry out this work. Fig.7 The test arrangement for squareness errors tests of YZ and ZX plane In this test arrangement in Fig.7, a horizontal XY plane contouring is carried out. Then, with the same setting-up and the same optic scale measuring system, let the spindle move up in Z-axis at a distance (offset). The second contouring test is then executed. With this optic scale measuring system, it is not necessary to change the linkage or the setting-up during this squareness test. If no squareness error exists the same analyzed initial setting-up errors (eccentricity) in both contouring tests will be obtained. Under this arrangement, the second sampled data must be modified before analysis. Therefore, )cos()()(AngleSetoutputTransducerdataModified= Where, )2()1 (cos1dtestnlinklongofLengthteststlinkshortofLengthAngleSet= After the sampling the original sample data with short link and the modified data with long link are analyzed by the least square fitting. The two individual analyzed initial set-up errors are used for the calculation of the squareness error. Squareness at ZX plane)(tan121OffsetXX = Squareness at YZ plane)(tan121OffsetYY = Where () is the analyzed center of the first contouring test 11,YXWhere () is the analyzed center of the second contouring test 22,YXOffset is the movement distance in Z-axis after the first contouring test 4.1The planar encoder contouring device for CNC machine tools The principle of the planar encoder A planar encoder system, such as Renishaw RGX grid plate, has been developed for applications such as semiconductor and electronics manufacturing equipment. The system uses read head with 2 orthogonal sensors that read a chegure-patterned grid in both X and Y directions simultaneously. The system with good dynamic response can provide up to 0.1 m resolution in positioning. Fig.8 shows the arrangement of the contouring test by using a simple planar encoder. This planar encoder provides positioning information in each axis for a 2D contouring. During the test, the planar encoder is set on the CNC machine tool. The reading head is fixed with the spindle of the CNC machine tool. The software of the computer via a counter card can read the sampling data. This sample-contouring device provides the following features. 1. During a contouring test, the individual contouring error in each axis can be obtained. This is useful for analyzing and compensating the contouring error. 2. The contouring area can be up to 300mm x 300mm with the selection of 0.1 m to 1m resolutions within this area, various contouring paths can be arranged. 3. It is easy for setting-up and operation. Fig.8 The planar encoder for contouring test 4.2 The test results A simple contouring test is carried out on a XY plane of a vertical CNC machine tool with 0M Fanuc controller. The contouring result is shown in Fig.9.The anti-clockwise and clockwise contouring tests at 20 mm radius can meet ISO 230-1and 230-2 requirements. From the results, the absolute radius error can be found easily. For general contouring systems, only out of roundness is given. Furthermore, the error in each axis can also be found individually if necessary. This is useful for analysis purpose. Fig.9: The contouring result with a planar encoder 4. THE SELF-SUPPORTED-LINKAGE SYSTEM (SLS) In this section, a self-supported linkage is developed for the application of contouring test under cutting condition. The proposed SLS is shown schematically in Fig.10. The system is composed of one high precision reference spheres rigidly mounted at spindle, four rods, a L-type fixed part, a fixed part, the magnetic base, a rotating axis and a non-contact sensor. A carbon fiber transducer link containing one non-contact sensor (eddy current sensor) is located between the reference spheres. The sensor output represents the change in center distance of the sphere as the machine performs a circular contouring operation. The additional supporting link between the fixed part and the rotating axis provides the whole linkage to be held in the horizontal plane during the test. A Special thanks was given to National Science Council, Taiwan, and Republic of China to support the work. (Number NSC- 89 - 2212- E 150 - 030) Fig.10.The structure of the self-supported linkage contouring system 5.1.The SLS for contouring test with cutting condition The SLS are herein used for testing the dynamic performance of CNC machine tools during the cutting process. The SLS cannot only be used for testing CNC machine tools under non-cutting situation, but also can be extended to test the dynamic performance during cutting process. It is of importance for the in-processing measurement. The SLS was employed to test the dynamic performance of a vertical CNC machine center (YG-FV6000 series) with a Fanuc OM controller. The test conditions are shown below: 1.The high-speed cutter (12 mm, SL4SE HS-CO) 2.Specimen (SS41) 3.Cut-width 12mm and cut-depth 1mm 4.Feed rate 50 (mm/min),Clockwise 5.Spindle speed 800r.p.m 5. Contouring radius 135 mm 6. DISCUSSION AND CONCLUSION For different purposes of the tests, proper measuring tool should be applied. In this paper four contouring systems are provided. With the similar software and the low cost of the hardware these systems provide good solutions for the application. The features of these systems can listed as followed. 1.The quadrant sensor contouring system provides short radius contouring. The dynamic error can be checked by the system successfully. 2.The optic scale measuring system provides long working range contouring. Thus both contouring and volumetric test can be arranged in the provided methods. The hollow sphere volumetric error test by this system and the methods for squareness errors in one setting-up are studied. For in - processing measuring, the self- supported- linkage system was developed for the contouring test with/without cutting condition. The system was verified by a simple model and experimental result. In summary, in this paper, the provided systems and measuring methods are useful for different test purposes on a CNC machine tool. ACKNOWLEDGMENTS REFERENCES J.B. Bryan, ”A Simple Method for Testing Measuring Machines and Machine Tools,” Prec. Eng., Vol.4, No.2, pp. 61-69.1982 W. Knapp, ”Test of the three-dimensional uncertainty of Machine Tools and Measuring Machines and its Rela
温馨提示:
1: 本站所有资源如无特殊说明,都需要本地电脑安装OFFICE2007和PDF阅读器。图纸软件为CAD,CAXA,PROE,UG,SolidWorks等.压缩文件请下载最新的WinRAR软件解压。
2: 本站的文档不包含任何第三方提供的附件图纸等,如果需要附件,请联系上传者。文件的所有权益归上传用户所有。
3.本站RAR压缩包中若带图纸,网页内容里面会有图纸预览,若没有图纸预览就没有图纸。
4. 未经权益所有人同意不得将文件中的内容挪作商业或盈利用途。
5. 人人文库网仅提供信息存储空间,仅对用户上传内容的表现方式做保护处理,对用户上传分享的文档内容本身不做任何修改或编辑,并不能对任何下载内容负责。
6. 下载文件中如有侵权或不适当内容,请与我们联系,我们立即纠正。
7. 本站不保证下载资源的准确性、安全性和完整性, 同时也不承担用户因使用这些下载资源对自己和他人造成任何形式的伤害或损失。
提示  人人文库网所有资源均是用户自行上传分享,仅供网友学习交流,未经上传用户书面授权,请勿作他用。
关于本文
本文标题:数控铣床Z轴进给系统设计【6张图纸】【优秀】
链接地址:https://www.renrendoc.com/p-423438.html

官方联系方式

2:不支持迅雷下载,请使用浏览器下载   
3:不支持QQ浏览器下载,请用其他浏览器   
4:下载后的文档和图纸-无水印   
5:文档经过压缩,下载后原文更清晰   
关于我们 - 网站声明 - 网站地图 - 资源地图 - 友情链接 - 网站客服 - 联系我们

网站客服QQ:2881952447     

copyright@ 2020-2025  renrendoc.com 人人文库版权所有   联系电话:400-852-1180

备案号:蜀ICP备2022000484号-2       经营许可证: 川B2-20220663       公网安备川公网安备: 51019002004831号

本站为文档C2C交易模式,即用户上传的文档直接被用户下载,本站只是中间服务平台,本站所有文档下载所得的收益归上传人(含作者)所有。人人文库网仅提供信息存储空间,仅对用户上传内容的表现方式做保护处理,对上载内容本身不做任何修改或编辑。若文档所含内容侵犯了您的版权或隐私,请立即通知人人文库网,我们立即给予删除!