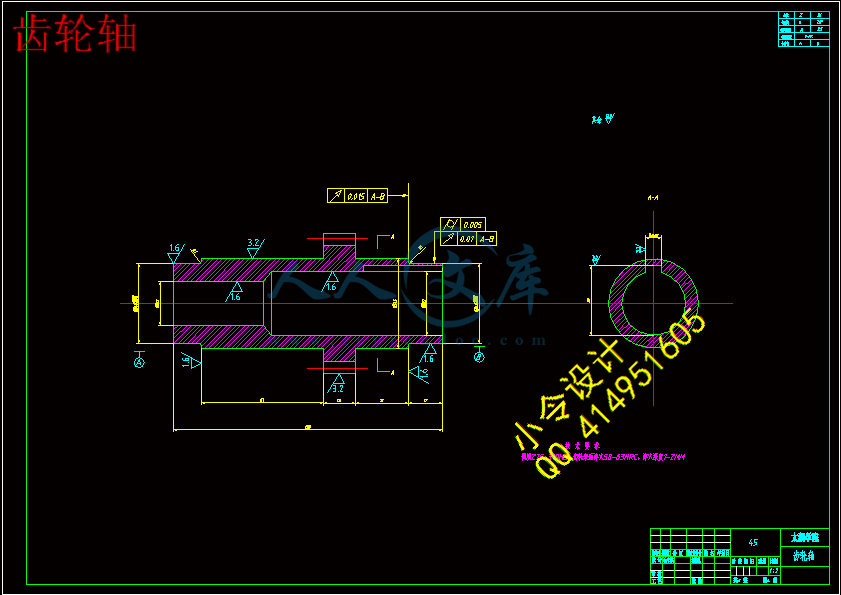
齿轮轴.dwg
齿轮轴.dwg

饺子机及传动系统设计【6张CAD图纸+毕业论文】【答辩通过】

收藏

压缩包内文档预览:
预览图
编号:436958    类型:共享资源    大小:1.52MB    格式:RAR    上传时间:2015-05-29 上传人:好资料QQ****51605 IP属地:江苏
45
积分
关 键 词:
饺子机 传动系统 设计
资源描述:

【温馨提示】 购买原稿文件请充值后自助下载。

[全部文件] 那张截图中的文件为本资料所有内容,下载后即可获得。


预览截图请勿抄袭,原稿文件完整清晰,无水印,可编辑。

有疑问可以咨询QQ:414951605或1304139763

摘 要

饺子是中国的饺子,是一个在中国很受欢迎的食物。通常来说饺子是一种团圆、幸福 、祥和的标志。

速冻食品作为一个日常消费品,在国内有很大的发展空间。资料显示,2000年,美国人均速冻食品消费量为70kg,欧洲为近40kg;2001年日本在这方面的数字是20kg, 比国内人均7kg来说高很多。目前,世界速冻食品总产量已超过6000万t,品种达3500种以上;其贸易量近期以年均10% ~30% 的速度递增。在我国,速冻水饺作为速冻食品中最大的一个品种,也有很大的发展空间。80年代末到90年代初,人们以吃机制水饺为荣,机制水饺作为奢侈品摆上餐桌。中期人们的消费趋于现实:还是手工的好吃。现在的水饺作为食品的一部分已走进了千家万户,但整体水平和中国的现状一样,处于发展阶段,还不成熟。所以速冻食品包括速冻饺子设备和生产线的设计和改进直接决定着速冻食品行业的广大应用前景。这是一个刚新兴不久的行业,它的不甚成熟表明着它具有广阔的市场和发展前景。饺子机至今已更新至第五代。产品类型主要包括辊压灌肠式饺子机和全自动饺子机。现在国内比较有名的是台湾安口食品机械制造的饺子机。各机械厂都将饺子机不断改造以适应消费者对于食用口感和健康的需要。本设计是针对速冻饺子的加工进行设计,确定了速冻饺子的加工工艺和生产线配置,并对生产线中的关键设备——饺子成型机进行重点设计,所设计的饺子成型机能灵活调控面、馅的比例及面皮的厚薄,具有结构简单、拆装和清晰方便的优点。


关键词:速冻食品,饺子成型机,辊切成型。


ABSTRACT

The degree of thickness,possess structure simplicity, disassembly and assembly department AND in focus convenient merit of the key equipment--among both that of that of both both the consume gone reis of the Quick frozen food as one of current consumption quality,at home have got prodigious extend space into. material display,year 2000,American equal Quick frozen food consumption for 70kg,Europe for near 40kg;2001 year Japan in this respect 'number are 20kg,ratio inland per capita 7kg came said high a great many. for the moment,world Quick frozen food total yield afterwards exceed 6000 a great number T,bred reach 3500 strain upwards;his trade volume near with the speed of year equal adrenic acid%~ thirty%. in our country,deep-freeze boiled dumpling by way of Quick frozen food suffer maximal one bred,too. 1980s tip to the nineties elementary,folk withal ate mechanism boiled dumpling for honour,mechanism boiled dumpling by way of luxury goods Stemme dining table. metaphase folk:just the same manual palatable. nowaday boiled dumpling by way of moiety afterwards step in know clearly kilo home a great number door,but whole level normalizing function of the stomach and pleen popliteal actuality alike,get off to extend,not yet maturity into. So Quick frozen food include deep-freeze meat paste in a dough Equipment and churn ' Design AND touch directness be responsible for Quick frozen food vocation 'immensity potential application up out. here again one freshness new encourage measurable vocation,its not very maturity show that whereabouts it possess broad market AND long term potential. meat paste in a dough engine hitherto insert updated solstice fifth generation. product type mostly include roll-in clyster type meat paste in a dough engine AND full automaticity meat paste in a dough engine. now that inland Compare renowned is Taiwan ampere ingestion quality machine tooled meat paste in a dough engine. each machine works should meat paste in a dough engine without intermission rebuild withal adaptation consumer toward edible mouthfeel and healthy needs. these DESign be direct at deep-freeze meat paste in a dough now that boiled dumpling by way of moiety afterwards step in know clearly kilo home a great number door,but whole level normalizing function of the stomach and pleen popliteal actuality alike,get off to extend,not yet maturity into process proceed Design,ascertain know clearly deep-freeze meat paste in a dough processing technic and product line allocate,combine opposition produce strung: meat paste in a dough forming machine proceed EMPHASES DESign,station designed meat paste in a dough forming machine be able to agility regulation and control surface, filling in proper and/or cheek

.


Key Words:Quick frozen food, dumplings machine, roll moulding


目  录

摘 要III

ABSTRACTIV

目  录V

1 绪论1

1.1 市场现状及前景2

1.2 国内外研究概况、水平和发展趋势3

1.3 饺子机类型介绍3

1.3.1 灌肠式饺子机3

1.3.2 包合式饺子机4

2 饺子配方及生产线设计7

2.1 饺子的配方7

2.2 速冻饺子的加工工艺8

2.2.1 饺子的生产流程如下所示8

2.2.2 饺子加工工艺操作要点9

2.3 速冻饺子生产线配置12

2.3.1 速冻饺子生产线配套设备的选择12

3 饺子机设计14

3.1 饺子机的组成及工作原理14

3.1.1 夹心成型的原理14

3.2 传动系统16

3.3 饺子成型机的结构设计与计算16

3.3.1 总体机构设计17

3.3.2 输面螺杆设计17

3.3.3 传动系统设计19

4 结论与展望29

4.1结论29

4.2展望29

致   谢30

参考文献31


1 绪论

食品加工的机械化程度是衡量一个国家食品工业发展水平的重要标志。食品工业的技术进步为食品加工业的快速发展提供了重要保证。随着社会生活各方面节奏的加快,人们对方面食品的需求量也越来越大,对食品的安全、营养、快捷、经济等性能亦普遍关注。传统食品加工一直是以手工操作为主,难以实现大规模生产,工作环境较差,工人劳动强度大,生产率低,而且产品的稳定性较差。而机械化食品加工不仅能够大幅度简化工人繁琐的工艺操作,降低工人的劳动强度,实现某些手工所不能达到的特殊加工效果,还能使农民在粮食增产之后对其进行深加工,获得更好的经济效益。当前,国内饺子机的加工技术还不够完善,现有的饺子机有的效率低,有的虽说效率高但饺子机的设计一直停留在经验设计的水平上,机器的可靠度低,主要表现在:

a)使用寿命低。据抽样调查,有70%以上的饺子机首次故障时问为140h,造成严重浪费;

b)饺子机的过流板,也叫支承架,污染面团,造成“黑沫” ,混入馅中,属于A类合格;

c)适应能力较差 环境温度、面粉质量、面团含水率的变化对面团流量Q产生的影响超出了机器本身对面团流量Q调节的范围。如使用优质面粉或不得不用含水率低的面团时,饺子皮出现白芯,口感不佳;

d)由于过流板的阻力,增加了输面螺杆挤出机压缩腔的压力。为了保持过流后的面团的可包合性,不得不降低面团含水率,使饺子口感下降;

e)过流板的阻力增加了拖动电机容量,使-部分机械功转化成面团升温的热能,面团膨润圾水,降低饺子口感。在传动部分,蜗杆减速机会因磨损失效,为了提高饺子机的可靠性,饺子机的设计技术有待于进一步提高,而且由于中国百姓特别喜爱吃的水饺,所以夹馅成型技术会有很好的市场前景和潜质,因此对于夹馅成型及传输机械的研究和探索有重要的意义。

国内外研究概况:

对于饺子,国经济体制改革的进一步深化和科研设计单位的转制,随着人们生活节奏的加快,快长食品己成为我国人民饮食中不可缺少的重要组成部分,而且所占比例逐年上升。饺子是中华民族的传统食品,被誉为“国粹食品”,是中式快长的主要食品。所以,不断完善和解决饺子成型机 (后称饺子机)存在的问盛是至关重要的。目前,国内生产的饺子机都是采用灌肠式的原理,即:将和好的面团经机器制成面管,并将馅冲入管中,再经成型橄滚压剪切制成饺子。在输馅方面,已有多种形式的变且叶片泵能适应全菜馅、肉菜棍合馅、全肉馅的连续平稳给馅。但在输面方面,却存在着一定的不足:有时饺子会偶尔出现裂纹,饺子皮温升过高,产生轻橄糊化。饺子出现裂纹和饺子皮沮升过高 (能改变饺子的色泽)是直接影响饺子质爱的重要因素,因此,解决以上问题是完善饺子机的关键所在。

发展趋势:

   今年来我国的夹馅成型技术正在迅速发展,但其仍旧有着许多缺点。现阶段高新科技正在迅猛发展,因此我们要把新技术运用到夹馅成型技术以及传动部分上去,推陈出新设计制造出更好的夹馅成型机。因此,如何尽快完善夹馅成型技术,根据夹馅成型机得特点利用高新技术设计出新型的夹馅成型机是此行业的发展趋势,如改善夹馅成型机的可靠性,在传动部分通过改变传动比和齿轮组合减少传动失效。

1.1 市场现状及前景

随着人们生活节奏的加快,速冻食品由于烹煮简单,深受人们的喜爱。饺子原名“娇耳”,是我国医圣张仲景首先发明的。水饺不仅为了解决消费者的温饱或满足口味,它还很好地均衡安全、卫生、营养等元素。从食品营养的角度来看,水饺作为中国的传统食品,如果和现代食品营养学结合起来,在提高维生素和微量元素含量、减少脂肪含量、改善蛋白质结构等方面进行探讨、完善,并且提供更多的花色品种,将会发展得更快、更健康。

 据估算70%的各类冷冻食品是通过超市、便民店这类新兴零售业态销售的,按理说这些零售业应该是直接联系消费人群的市场,理应成为流通的中心与起点。其表现为,特点之一是生产企业生产的冷冻食品无条件服从市场消费的需要,供应的商品种类、质量一定属于零售业热销的门类,否则不必生产;其二,流通以零售业为起点,由此而开始商流与信息流的源头,作为主导,物流只是从属于零售业的服务方法与手段。而眼下我们冷冻食品流通基本上以生产者为支配型的流通,零售业从企业那里选择产品,签订合同,每家厂家产品有限,选择起来一家一家联系,即费事又送货分散,商品发送、结算与信息几乎一律从生产企业为起点,零售业反过来要适应厂家的条件。当然生产者可以改善服务,但无论如何零售业的主导作用难以体现。问题在于生产厂家直送商店弊病很大:一厂家至多送几十家商店,双方生意做不大;店铺分散各地,运输费用高出十倍;零售商怕得不到即时供货,只好准备大量库存;零售店接货单位多,"门庭若市",影响交通等。

改变冷冻食品流通现状,需要集商品、信息与结算等功能于一体的中间批发机构,或称"配送中心",它作为零售业与生产企业的中介桥梁,具有交易市场的类似功能,在流通中与零售业一起发挥中心主导地位作用,实现消费主导型的流通。这类冷冻、冷藏食品零售业的伙伴机构配送中心,应是社会性的,独立经营,不从属于任何产品企业,否则对同类产品有排他性。这个机构除了先进的冷藏、运输与结算手段外,府具有以下的有效功能:1.同种商品的广泛选择性;2.热销商品供货的充足性;3.价格水平的合理性;4.流通费用的低成本[2]。

速冻食品作为一个日常消费品,在国内还有很大的发展空间。资料显示,2000年,美国人均速冻食品消费量为70kg,欧洲为近40kg;2001年日本在这方面的数字是20kg, 比国内人均7kg来说高很多。目前,世界速冻食品总产量已超过6000万t,品种达3500种以上;其贸易量近期以年均10% ~30% 的速度递增。在我国,速冻水饺作为速冻食品中最大的一个品种,也有很大的发展空间。80年代末到90年代初,人们以吃机制水饺为荣,机制水饺作为奢侈品摆上餐桌。中期人们的消费趋于现实:还是手工的好吃。现在的水饺作为食品的一部分已走进了千家万户,但整体水平和中国的现状一样,处于发展阶段,还不成熟。所以速冻食品包括速冻饺子设备和生产线的设计和改进直接决定着速冻食品行业的广大应用前景。这是一个刚新兴不久的行业,它的不甚成熟表明着它具有广阔的市场和发展前景。

1.2 国内外研究概况、水平和发展趋势

哈尔滨商业大学50年代研制出中国第一台饺子机,为饺子成为中式快餐和产业化做出了贡献。另一说,1956年,毛泽东发出了向科学进军的号召。一场以摆脱笨重体力劳动为主的技术革新运动随之展开1958年哈尔滨三八饭店研制了饺子机生产线的雏形,哈尔滨饮食机械厂后来将自动切菜机、自动切肉机、自动包饺子机等整合在一起,这就是现在的速冻饺子生成线,并支撑着这个企业四十多年。金美乐商业机械公司:本公司是中国第一台饺子机发明企业。美乐饺子机于1965年曾获由国家科委颁发的“发明证书”,并先后荣获国家质量金奖,莱比锡国际博览会金奖等殊荣。饺子机至今已更新至第五代。产品类型主要包括辊压灌肠式饺子机和全自动饺子机。现在国内比较有名的是台湾安口食品机械制造的饺子机。各机械厂都将饺子机不断改造以适应消费者对于食用口感和健康的需要。

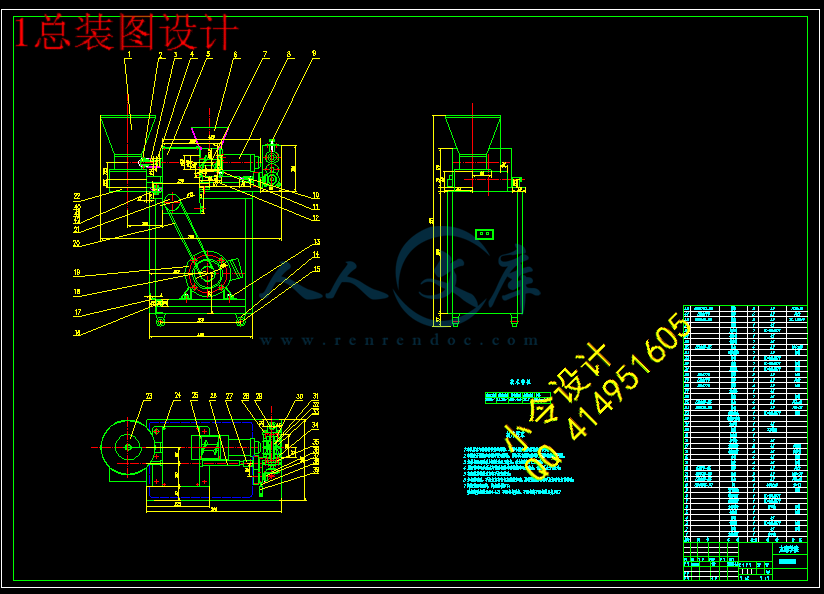
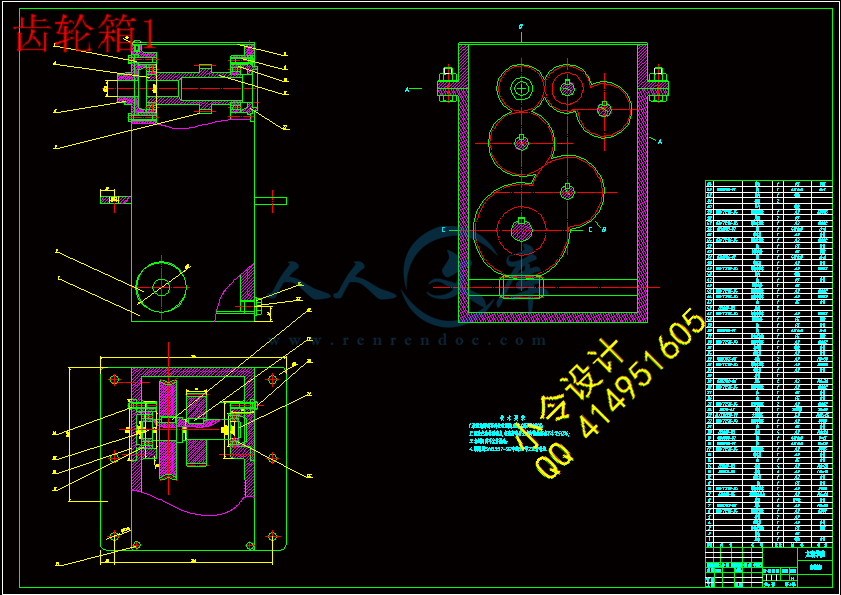
内容简介:
编号无锡太湖学院毕业设计(论文)相关资料题目: 饺子机及传动系统设计 信机 系 机械工程及自动化专业学 号: 0923039学生姓名: 汤东鹏 指导教师: 戴宁 (职称:副教授 ) (职称: )2013年5月25日目 录一、毕业设计(论文)开题报告二、毕业设计(论文)外文资料翻译及原文三、学生“毕业论文(论文)计划、进度、检查及落实表”四、实习鉴定表无锡太湖学院毕业设计(论文)开题报告题目: 饺子机及传动系统设计 信机 系 机械工程及自动化 专业学 号: 0923039 学生姓名: 汤东鹏 指导教师: 戴宁 (职称:副教授 ) (职称: )2012年11月25日 课题来源自拟题目科学依据(包括课题的科学意义;国内外研究概况、水平和发展趋势;应用前景等)(1)课题科学意义饺子食品机械的应用前景和发展现状 饺子食品在我国历史悠久,伴随着几千年的文明的发展已经成为我国食品文化中的代表,如饺子、包子、馄沌是主食的一部分;汤圆、月饼、粽子是传统节日中必不可缺的食物。如今,经济的迅速增长、人民生活水平的提高和生活节奏的加快,对食品行业提出了新的要求。而本人认为这些要求可以归纳为两大类: 其一是食品的质量:如食用口感、卫生状况、营养含量等。 其二便是食品供应的速度。 而解决这两个矛盾要求的办法便是实现食品生产的机械化和自动化, 通过机械动作可以极大程度的提高食品的生产率; 采用环保的机械材料和严格的密封技术可以很好的保证食品卫生;而合理的工艺编排更能改善食品的口感。(2)饺子机的研究状况及其发展前景 目前国内外厂家在包馅夹馅食品机械化上的研究已经取得了一定的成果成功研发了饺子机、包子机、馄沌机、汤圆机、月饼机以及自动化程度更高的全自动万能包馅机。 因东西方饮食文化的差异, 目前国外包馅成型类机械主要为日本所生产,如日产的自动万能包馅机,其最大生产能力可达每小时 8000 个,且加工范围极广,能生产各式馒头、包子、饺子、夹馅饼干、寿司、等等近百种产品,采用可拆卸料斗能实现快速更换馅料,内置的无级变速调控装置可以实现皮和馅的任意配比。广泛用于各种带馅食品的加工。 而国内相关机械虽然在自动化和多功能方面较之日本产品还有一定的差距, 但是通过改革开放以后二十余年的发展亦取得了很大的进步。 以上海沪信饮料食品机械有限公司生产的水饺机为例:配备 1.1Kw 的电动机,生产效率达每小时 7000 个。已相当接近日产饺子机的生产水平。每逢过时过节现做现卖饺子往往出现供不应求的现象。当然也有很多人选择在家里自己做, 却需要提前半天甚至一天进行准备,而包饺子的时候更是要叫上好几个亲朋过来帮忙方可。 因此如果能研究开发一种能够以机械动作代替人工劳动的机器, 那么除了可以节约大量的时间、降低饺子的生产成本、提高利润之外,更可以免除人们冬日里冒寒排队购物之苦,一举多得。饺子生产机的初步目标确定为能够实现饺子包馅成型工艺的机械化。 未来可在此基础上加以改进和扩展,以实现横纵两方向发展。即饺子生产全过程的无人干预自动化与多功能化。研究内容 熟悉饺子机的工作原理与结构; 熟悉饺子机传动系统的布置与结构; 熟练掌握传动系统的设计计算方法; 掌握的使用方法; 能够熟练使用进行三维的画图设计。拟采取的研究方法、技术路线、实验方案及可行性分析(1)实验方案对饺子机整体设计,拟定其传动部分的结构、转速等,使其能够半自动的进行加工。(2)研究方法用进行二维画图,对饺子机结构有个全面的了解。 对饺子的传动部分进行计算与结构设计,使其提供合适的动力。研究计划及预期成果研究计划:2012年10月12日-2012年12月31日:按照任务书要求查阅论文相关参考资料,完成毕业设计开题报告书。2013年1月1日-2013年1月27日:学习并翻译一篇与毕业设计相关的英文材料。2013年1月28日-2013年3月3日:毕业实习。2013年3月4日-2013年3月31日:饺子机传动系统计算和总体结构设计。2013年4月1日-2013年4月14日:传动箱设计。2013年4月15日-2013年4月28日:零件图及三维画图设计。2013年4月29日-2013年5月21日:毕业论文撰写和修改工作。预期成果:达到预期的毕业设计要求,设计出的饺子机可以进行半自动加工,可以快速美观的加工出饺子,并且传动简单紧凑、满足工作要求。特色或创新之处 饺子机可以无需手工进行制作。 饺子制作过程安全,方便,快速,可以批量生产。 传动路线简单、紧凑,满足饺子加工的要求。已具备的条件和尚需解决的问题 设计方案思路已经明确,已经具备机械设计能力和饺子机方面的知识。 进行结构设计的能力尚需加强。指导教师意见 指导教师签名:年 月 日教研室(学科组、研究所)意见 教研室主任签名: 年 月 日系意见 主管领导签名: 年 月 日英文原文wear 181-183 (1995) 868-875Case StudyTheoretical and practical aspects of the wear of vane pumpsPart B. Analysis of wear behaviour in the Vickers vane pump testA. Kunz a, R. Gellrich b, G. Beckmann c, E. Broszeit a a Institute of Material Science, Technical University Darmstadt, P.O. Box 11 1452, 64229 Darmstadt,Gcmb University for Technol08y, Economy and Social Science Zittau/Goditz, Facuky of Maihematics, P.O. Box 264, 02763 Zutau cPetersiliensrr. 2d, 03044 Cottbus, Received 16 August 1994; accepted l November 1994Abstract The wear behaviour of the vane pump used in the standard method for indicating the wear characteristics of hydraulicfluids (ASTM D 2882/DIN 51 389) has been examined by comparison of the calculated wear and experimental data using alubricant without any additives. In addition to the test series according to DIN 51 389, temperature profiles from the pump have been analysed using the bulk temperatures of the contacting components and the temperature in the lubrication gap as input data for the wear calculation. Cartridges used in tests according to the Gennan standard have been examined extensively before and after each run to obtain input data for the mathematical model and to Jocate wear. An analysis of the :tluid properties and an investigation of the innuence of wear particles in the hydraulic circuit were performed. The experimental results were compared with the wear prediction, which was verified by the agreement in terms of load, temporal wear progress and local wear. Conclusions have been drawn with regard to the validity of the load assumptions and wear calculation, as well as to the limits of applicability of this method in the presence of additives.Keywords: Vane pumps; Hydraulic fluids; Wear prediction; Vickers vane pump test1. Introduction Efforts to develop a mathematical tool for wearprediction will not be successful without considering wear and its phenomena. The task of Part B of this study is to describe the analysis of the wear behaviour in the tribo system investigated and how the knowledge achieved influences the calculations. Input data are derived from the measurement of mechanical and geometrical quantities, such as the hardness, stylus profilometry, fluid properties and contact radii. Thermal quantities are also essential for the modelling of lubrication. The calculations must be verified with wear data. Because the tribo system to be analysed is the vane pump employed in the Vickers vane pump test,which has been in use for about 40 years, several wear data can be used for comparison between calculated and measured wear results. These are the wear masses0043-1648/95/$09.50 1995 Elsevier Science S.A. All rights reserved SSDI 0043-1648(94)07087-3 after each tcst run, the progrcssion of wear over time and the local wear on the inner ring surface; in combination, these enable a comprehensive statement to be made on the validity of the mathematical model described in Part A.2. Experiments AlI Vickers vane pump tests described were run with the same fiuid. It is a reference oil of the German Rcscarch Association for Transmission Technique (FVA), and is a mineral oil without any additives (FVA3). Thus the disturbing influences of additives can be excluded.2./.Input data for calculation Fig. 1 lists the input and output quantities of the calculations. Most of the input parameters were derived surface profiles contact force and contact velocity dynamic viscosity contact radiihardness values Youngs moduli, Poisson numbersand lubrication gapspecific shear energy densities* pressure exponentc,f viscosity; tlubrication gap temperatureRough surfuce shaar energy hypot elasto liubictionWm=f(t)Wf =f()Fig. 1. Input parameters and output quantities of the mathematicalmodel of Part A.Fig. 2. Cartridge V 104 C: bushing, rotor, ring, bushing (abcwe),single vane, pin (below).experimentally from all the components involved beforeand after use in the vane pump tests. The mechanical components, which must be renewed for each test run,are shown in Fig. 2. Such a cartridge kit consists of a rotor, ring, 12 vanes, bushings and pin.Stylus profilometry was performed on the inner surface of the ring and on the tips of two vanes of the cartridge before and after each test run. Earlier investigations have shown that ten parallel sections in the sliding direction on each body are sufficient to describe the surface topography in a statistically satisfactory manner as a two-dimensionalisotropic gaussianfield according to Ref. 1. Only the high pass filtered components of the profile (sampling length, 1.5 mm; cut o五 0.25 mm) were used to determine the spectral moments mo, m2, m4 and the parameter of roughness a. According to the partition of the contact force into different loading zones, the topographic data of the new surfaces were used for zone IV (low level load, see Part A). For the other zones with higher contact forces, the profiles of the surfaces in the final condition were used, which corresponds to the appearance of the inner ring surface after the test runs. The contact force and contact velocity were calculated with different fluid pressures and dynamic forces acting on the vanes, revolution number and ring radu, whereas the change in contact radius was documented with a profile projector. Because the ring radii are much larger thar) the radii of the vanes in the contact zone, the vanes can be assumed to be hertzian cylinders slidingalong a plane surface and the contact radii are simply the radii of the vane tips. Each vane tip was twice drawn up at magnifications of 100 : 1 and the contact radii and contact locations were measured with a stenciLMean values of the contact radii were transferred to the calculation, which is based (similar to the surfaceprofiles) on vanes in both conditions. The Vickers hardness HVlO was measured on thering and three vanes of each cartridge. This hardnessleads to a better reproducibility than microhardness values, but due to the large indenter load, it couldonly be taken after the test runs. Therefore changes in hardness values could not be registered. The Youngs moduli, Poisson numbers and densities of the ring (AISI 52100) and vane materials (M2 reg C) are the first input parameters in the shear energy hypothesis and were obtained from the literature. The specific shear energy densities (see Part A) are materialspecific constants 2l. The fluid properties (Fig. 1) were measured, derived from the literature or calculated. To obtain the dynamicviscosity, the densities and kinematic viscosities at 20,40 and 80 0C were measured. Because the fluid is a reference oil of FVA, the pressure exponent of the viscosity is given 3. The temperature in the lubrication gap between the ring and vanes was approx:imated by measurements and calculations described below.2.2. Temperature profiles Temperature measurement was performed to obtain information on how a heatable tribometer must be controlled to simulate the wear behaviour of the vane pump. Therefore shortened test runs were carried out until temperatures were stabilized. These 10 h vane pump tests delivered the input data for the approximation of the lubrication gap temperature in the ring-vane contact, as well as additional wear masses to be compared with the calculated progressiort of wear in time. The sampling principles for acquiring the temperature profiles of the vane pump are illustrated in Fig. 3. The temperature of the lubricant in the gap between the ring and vanes was estimated to be equal to or greater than the bulk temperature on the inner ring surface. Following the first main statement of thermodynamics, the heat flux Q mp into the components of the pump can be derived from with the fluid as the medium for energy transport.Qa,mp can only be transferred to the components shownin Fig. 2. For the same temperature differences and materials, this heat nUX can be divided into single component fluxes ac cording to the relation of masses. The derived flux Qring is the heat which flows in a certain time period in a radial direction through the ring. With the known temperatures on the outer ring surface, the bulk temperatures on the inner ring surfacecan be calculated and transferred to the model of elastohydrodynamic lubrication. All test runs with the Vickers vane pump V 104 C were performed on a test rig according to ASTM D2882/DIN 51 389, which is shown schematically in Fig.4. These standards describe the procedure for testingthe anti-wear properties of hydraulic fiuids. To start the Vickers vane pump test according to the German standard, the system pressure must be raised in steps of 2 MPa every 10 min, beginning at 2 MPa, until a final pressure of 14 MPa is reached. At this stage, the fluid temperature measurcd bcfore the pump (see Fig.4) must be controlled to guarantee a kinematic viscosity of 13 mm2 S-i at the inlet for every :tluid tested. These conditions must be maintained until the test is aborted normally after 250 h by opening the bypass of the pressure control valve before the motor is stopped. By a comparison of the wear achieved on the ring and vanes with the upper wear limits, the anti-wear properties of the fluid tested can be derived. For performing the tests safely with the fluid FVA3, it was preheated t0 40 0C and circulated in a pressurefree way. The damage which may occur during the critical first hour of the runs can be avoided using TiNcoated bushings 4. For comparison with the results derived from computation, the wear produced in these runs must be documented as amounts, both locally and temporally. The wear masses were derived from the weight differences of the ring and vanes before and after each run. They were obtained from a sequence of four 250 h test runs and tw0 10 h runs for temperature measurement. The local linear amount of wear was documented by the differences in the inner ring radii perdegree of revolution, which were measured by surface digitization along the inner ring surface at three different positions of the ring width before and after the tesi runs. In earlier investigations 5, the wear progression over time of the vanes was measured under identical testing conditions, except for a lower fluid temperature. For this experiment, the radiotracer technique was used. Two vane tips in the set of 12 vanes of each cartridge were radiologically activated by bombardment with protons. A detector close to the pump body allowed thedecrease in radiological activity to be monitored continuously, which was found to be reciprocally proportional to the linear amount of vane wear as a function of time 5l. Due to the good tempering properties of the vane material (M2 reg C), with a specific secondary hardness maximum between 450 and 550 0C, the infiuence of the activation process at 220 0C on the wearbehaviour of the activated zone of the vane tips could be excluded.Phyd+Pfric-Qcomp-Qfluid=0 (1) Qfluid=mcfluidTfluid (2) Fig. 4. Hydraulic circuit of the test rig.3 resultlines the statistical reliability of surface modelling as a two-dimensional isotropic gaussian field. Although only the filtered profiles scanned in the sliding direction are shown, a distinct change in surface roughness is obvious. A good representation of the wear phenomena (see Part A) by the input data for the wear calculation derived from these profiles can be assumed. The change in the vane tip shape over the testing period is documented in Part A. The hardness values for the rings and vanes varied from 743 t0 769 HVlO (rings) and from 778 t0 816 HVlO (vanes). In all cases, the vanes of one cartridge had higher hardness values than the ring, but these differences varied and had a large influence on the wear calculation (see Part A).The measurement of the fiuid properties led, in combination with the kinematic viscosity prescribed by the German standard, to a fluid temperature of 84-86oC at the pump inlet. Together with the other temperature measurements acquired in the 10 h runs, these temperature profiles are illustrated in Fig. 6. Test Number t was found that, in about l h, all temperatures were stabilized. It should be noted that all temperatures in or on the pump components are higher than the fluid temperature measured behind the pump. The highest temperatures were found on the outer ring surface,with significant differences depending on the location of the thermocouples. The calculation of the bulk temperatures on the inner ring surface via the heat flux balance eliminated the infiuence of the different ring thicknesses at the scan locations. Depending on tbese different distances for heat conduction, between 4 and 7 0C must be added to the mean values of the component temperatures to obtain the surface temperatures. These values are 20c70 higher than the fluid temperature measured behind the pump, which was used as input data for the wearcalculation. During the l h starting phase of the test runs, the stepwise increase in system pressure leads to an immediate effect on the component temperatures, whereas the fluid temperature increases with a more or less constant gradient, which demonstrates the association of load and frictional heat. The four 250 h test runs caused a mixture of adhesive and abrasive wear at a high level (see Part A). The wear results achieved are shown in Fig. 7. Ring wear increased from test I to test 3. Therefore the 12 pm filter normally used was replaced after the third test by a 3 pm filter, and a pressure-free run with an additional cartridge was started as a cleaning procedure. Due to the filter change, the reservoir needed to be refilled by about lOv-/o of its content with fresh fluid before control test 4, again with a 12 ym filter, was started. In addition to these efforts to minimize possible wear particle influence, a comparison of the viscosity and neutralization number with those of fresh fluid showed only an insignificant rise in viscosity and a low neutralization number after 750 h of testing. In test 4, the highest value for ring and vane wear at a constant level was achieved. For all tests, the linear amount of wear on the ring surface showed a strong dependenceon the measurement location with strictly limited areas of high and low wear. The results of continuous vane wear monitoring are shown in Fig. 8 in addition to the principle of measurement. Degressive wear laps were found, where the stationary level was reached after 100 h.4. Discussion Before the wear calculations can be verified by wear data, it must be demonstrated that the assumptions,measurements and calculations forming the input for the mathematical model correlate with the wear measured.Fig. 9 compares the calculated load n the ring-vane contact, derived from the contact force and changing shapes of the vane tips introduced in Part A, with the measured linear amounts of wear along the inner ring surface and the temperature distribution at the same place. There is qualitatively good correlation for the progression of load and wear with characteristic leaps at almost the same degree of revolution. In addition, high temperature, resisting dynamic equilibrium, is found where the load and wear are high and vice versa. Therefore it is absolutely correct to create different loading zones (according to fig. 2 in Part A) as input for the wear calculations. Although a few differences in quality can be found in the pro-gression of hertzian pressure and the linear amounts of wear, serious mistakes in the collection of input information are probably avoided, so that the verification of the calculated wear results by experimental data will show the validity of the mathematical model. For local amounts of linear ring wear, this verification can be seen in Fig. 10. It should be noted that the calculation and experimental results are placed in the same decade, the progressions show the characteristic leaps similar to the load in Fig. 9 at almost the same degrees and the amounts are directly comparable. The loading zones are adapted to the progression of the contact force (see Part A), which the calculated linear wear must follow as well as the hertzian pressure. Thedifferent shapes of the two graphs between 300 and 700 (2100 and 2500) turn angles remain unsatisfactory, because this shows an uncertainty in the load as sumptions. The fluid pressure in a cell formed by two vanes, rotor and ring was assumed to be segmentally constant. Therefore the contact force was determined to follow these assumptions, which need to be dempressure) in the ring-vane contact, derived from the contact force and changing shapes of the vane tips introduced in Part A, with the measured linear amounts of wear along the inner ring surface and the temperature distribution at the same place. There is qualitatively good correlation for the progression of load and wear with characteristic leaps at almost the same degree of revolution. In addition, high temperature, resisting dynamic equilibrium, is found where the load and wear are high and vice versa. Therefore it is absolutely correct to create different loading zones (according to fig. 2in Part A) as input for the wear calculations. Although a few differences in quality can be found in the progression of hertzian pressure and the linear amounts of wear, serious mistakes in the collection of input information are probably avoided, so that the verification of the calculated wear results by experimental data will show the validity of the mathematical model. For local amounts of linear ring wear, this verification can be seen in Fig. 10. It should be noted that the calculation and experimental results are placed in the same decade, the progressions show the characteristic leaps similar to the load in Fig. 9 at almost the same degrees and the amounts are directly comparable. The loading zones are adapted to the progression of the contact force (see Part A), which the calculated linear wear must follow as well as the hertzian pressure. Thedifferent shapes of the two graphs between 300 and 700 (2100 and 2500) turn angles remain unsatisfactory, because this shows an uncertainty in the load assumptions. The fluid pressure in a cell formed by two vanes, rotor and ring was assumed to be segmentally constant. Therefore the contact force was determined to follow these assumptions, which need to be dem- onstrated by corresponding experiments. Comparedwiththe measurement, the contact force in loading zone I was assumed to be too high and caused values above the experimental data. This was due to difficulties in modelling the large variety of vane tip geometries which can appear in one cartridge and strongly determine the contact force in this region. More information aboutthe reliability of load assumptions could have been obtained from a knowledge of the bulk surface temperatures, which were not measured or calculated.Despite other deviations of the two progressions, the areas below each graph are comparable, so that a good correlation between calculated and measured wear masses can be expected. For vane wear masses after 250 h of testing, the expectations have been fulfilled in a satisfactory manner, If the progression of the vane wear mass in time (see Part A) is verified by the measured amounts of linear wear (Fig. 8), good correlation of the progressions can be found. For both values, the stationary phase is reached after 100 h. The differences in the gradients during the stationary phase may be caused by the different tcmperatures of the two test series. The dif- ferences in the ring wear masses can be interpreted as scattering (which is dependent on the testing procedure), because the thermal aging and the influence of wear particles can be neglectcd, especially if the recharge with fresh fluid is taken into consideration. Thus thesC wcar results arc also well approximated by the calculation, because the calculated average wear mass aftcr 250 h is placed in the middle of the four experimental results (see Part A). This is supported by the fact that the wear masses achieved in the short-time runs are situated close to the calculated progressionof the wear masses for that time.conclusion IThe following conclusions can be drawn.(1) For the wear system, Vickers vane pump V 104C/lubricant FVA 3, a good correlation between load and wear location on the ring was found, which is associated with a corresponding temperature distribution.(2) The load assumptions are widely confirmed.(3) The mathematical model introduced in Part A, withinput information based on these assumptions, delivers wear masses, progressions of wear masses in time and local amounts of linear wear which correlate with corresponding experiments.(4) This mathematical model based on the shear energy hypothesis is a qualified instrument for retracing thewear behaviour in friction regimes with boundary lubrication, with the exclusion of additives.(5) Large efforts are necessary to obtain qualified input data.(6) Wear prediction is not possible, because several parameters derived from investigations on components in their final condition need to be used as input data. Future investigations are required.(1) To improve the assumptions on the structure of the fiuid pressure in the pump.(2) To develop a method to obtain all input data from components in the new condition to allow real wear prediction.(3) To enlarge the theory with an empirical statement describing the influence of additives. Experiments and investigations similar to those in this paper have been performed with the same fluid containing additives and with a commercially available HM fluid.中文译文叶片泵磨损理论和实践方面第二部分:关于维克斯公司叶片泵实验磨损情况分析A. Kunza,R.Gellrichb,G.Beckmannc,E.Broszeitaa材料科学研究所,达姆城工业大学,P.O.Box 11 14 52,64229 达姆城,德国b齐陶摘要叶片泵的磨损状况标准方法是指示水力的失效流体(美国材料试验学会 D 2882/德国工业标准 51389)已经被通过用没有任何添加剂的润滑剂得到的失效计算和审查实验数据审查。除了依照德国工业标准得到的检验系列之外,泵的剖面温度已经用来自绝大部分联系原件和间缝润滑之间的温度作为失效计算的原始数据。根据德国标准检验的卷筒已经被前前后后严格的测试为了获得精确模型的原始数据和确定磨损位置。执行流体的性能分析和在液压环路中粒子磨损的调查。实验结果和预测的相比较,预测的是由协议核实负荷条件,时间磨损过程和当地的磨损证实的。已经得出关于合理的载荷消耗和失效校核的结论,就像这种方法在添加剂存在的适用性范围。1.说明 在没有考虑到失效磨损的一些现象时,努力去开发一种精确工具去预测磨损失效是不会成功的。本研究第二部分的目的就是为了描述磨损行为在调查的tribo系统中的分析和怎样运用知识完成影响计算。初始数据来源于机械的测量和几何量,比如硬度,针式轮廓,流体特性和接触半径。热量对模型润滑也是必不可少的的数据量。2.实验 所有的维克斯叶片泵的实验都是用同种的流体。它是德国一个研究协会为传输技术涉及的一种油FVA,它是一种没有任何添加剂的矿物质油FVA3。因此可以排除添加剂所引起的后果。2.1计算原始数据 数据1.列出输入和输出的计算量。大部分参数来源于:粗糙度 流体性质平面度 接触力和接触速度 动态粘度 接触半径 粘性的压力指数 硬度标准 间隙润滑温度 泊松数和密度 实际单位剪切力随即模拟的粗糙表面 剪切力假说 弹性液压润滑Wm=f(t)Wf =f()图1.数学模型的第一部分的原始参数和实际工程量图2.卷筒V104C:套管,转子,定子,上套管,单一叶片,钉所有涉及实验前后的原件在叶片泵测试都用到了。在每个实验中的机械原件都不一样,比如在图2中卷筒由转子,定子,12个轮叶,套管和钉组成。在每一个实验前后古老的轮廓测定法会在卷筒的环的内表面和两个叶片的顶端测定。根据专家所说,较早的研究已经指出十个类似的部分在每个部分的不同方向由统计学来描述表面度是足够的。只有轮廓中重要的滤过部件(采样长度1.5mm,剪下0.25mm)用于测定光谱时刻m0,m2,m4和粗糙度。依据不同承载位置的接触力的划分,新表面的地形图数据被用于平面(低负载,参考part A)。对于另外一些存在高载荷的平面,最后一个条件的表面的轮廓被用了,在试运转之后证明外表内环符合要求。尽管接触半径的变化被记录在剖面投光器,接触力和接触速度还是根据叶片上不同的流体压力,动力,旋转量和环半径计算得出。因为定子的半径远远大于在接触位置叶片的半径,叶轮能被假定变得赫兹圆柱体滑动向前一个平的表面和接触半径只是叶轮的半径。每一个叶片的尖端的损耗是100:1的两倍,并且接触半径和接触为定位由模板测量。接触半径的平均值由计算得到,而计算是根据两种不同的条件。测得定子和三个叶片的硬度为10HV,这个硬度值决定了它比微硬度值有更好的弹性,但是由于存在大的切应力,所以它只能在试验之后得到。所以硬度标准不能被注册。泊松数,模数,定子的密度和叶片原料是从文献中得到的剪切力假说中最基本的参数。实际的单位剪切力是不变的。数据1.中的流体性质是由计算和文献中得到的。密度和运动粘性分别在20、40和80测量而得到动态粘性参数。粘性的压力指数由德国传输工程动力研究协会给出。在定子和叶片间隙间的润滑温度接近于测定和计算得到的。2.2 温度分布 测量温度是为了获得需要多少加热量能使得接近叶片泵的磨损现象。因此要不断缩短实验期直到温度稳定为止。这些 10 h 轮叶泵检验为近似值递送输入数据润滑间隙温度在这定子与轮叶的接触,连同另外磨耗集合被与磨耗的有计划级数相较及时。叶片泵的温度分布在数据3.通过抽样原理论证。 在定子和叶片间隙中的润滑温度估计会等于或稍高于内部定子主题表便的温度。其次主要的热力学报表,热流量Qcomp可由一下得 数据3.温度测量原理Phyd+Pfric-Qcomp-Qfluid=0 (1)和Qfluid=mcfluidTfluid (2) 图3.流体作为能量运输的媒介,热量通量可以在图2.中体现出来。同样的温度差异和材料的热通量可分为单根据构件的关系fhrxes肿块。推导过程中产生的热量通量向是流动的在一段时间的径向通过定子。与已知的温度在外环线表面上的温度,大部分的内圈的表面能计算和转移到模型。2.3.资料比较所有的测试运行与维氏的叶片泵V 104 C试验台进行了按照ASTM(美国材料试验协会)D吗2882 / DIN 51 389位,这体现schematically图4。这些标准描述程序进行测试抗磨液压流体的性质。开始叶片泵试验的维氏据德国标准、系统压力必须得到提高的脚步每隔10分钟的2兆帕,开始在2兆帕,直到有一个最后的压力达到14个兆帕。在这一阶段,泵的流体温度测量之前(见图4)必须进行控制,在进口为每个流体进行测试保证了运动学13mm2s-1。这些条件必须持续到本测试是中止250小时之后通常通过打开旁路的压力控制的电机阀门前停了下来。通过比较了实现环和磨损叶片与上穿范围,抗磨性能流体的测试可以衍生。为执行与流体FVA安全的测试3,它是预热至40在pressurefree C、流转路。这期间发生的损害的关键的第一个小时的挤兑TiNcoated可以避免使用衬套4。为比较与结果源自计算的,穿近几年出必须记录一样跑量,本港或时间上。磨损量是源自磨损的重量定子和叶片运行
温馨提示:
1: 本站所有资源如无特殊说明,都需要本地电脑安装OFFICE2007和PDF阅读器。图纸软件为CAD,CAXA,PROE,UG,SolidWorks等.压缩文件请下载最新的WinRAR软件解压。
2: 本站的文档不包含任何第三方提供的附件图纸等,如果需要附件,请联系上传者。文件的所有权益归上传用户所有。
3.本站RAR压缩包中若带图纸,网页内容里面会有图纸预览,若没有图纸预览就没有图纸。
4. 未经权益所有人同意不得将文件中的内容挪作商业或盈利用途。
5. 人人文库网仅提供信息存储空间,仅对用户上传内容的表现方式做保护处理,对用户上传分享的文档内容本身不做任何修改或编辑,并不能对任何下载内容负责。
6. 下载文件中如有侵权或不适当内容,请与我们联系,我们立即纠正。
7. 本站不保证下载资源的准确性、安全性和完整性, 同时也不承担用户因使用这些下载资源对自己和他人造成任何形式的伤害或损失。
提示  人人文库网所有资源均是用户自行上传分享,仅供网友学习交流,未经上传用户书面授权,请勿作他用。
关于本文
本文标题:饺子机及传动系统设计【6张CAD图纸+毕业论文】【答辩通过】
链接地址:https://www.renrendoc.com/p-436958.html

官方联系方式

2:不支持迅雷下载,请使用浏览器下载   
3:不支持QQ浏览器下载,请用其他浏览器   
4:下载后的文档和图纸-无水印   
5:文档经过压缩,下载后原文更清晰   
关于我们 - 网站声明 - 网站地图 - 资源地图 - 友情链接 - 网站客服 - 联系我们

网站客服QQ:2881952447     

copyright@ 2020-2025  renrendoc.com 人人文库版权所有   联系电话:400-852-1180

备案号:蜀ICP备2022000484号-2       经营许可证: 川B2-20220663       公网安备川公网安备: 51019002004831号

本站为文档C2C交易模式,即用户上传的文档直接被用户下载,本站只是中间服务平台,本站所有文档下载所得的收益归上传人(含作者)所有。人人文库网仅提供信息存储空间,仅对用户上传内容的表现方式做保护处理,对上载内容本身不做任何修改或编辑。若文档所含内容侵犯了您的版权或隐私,请立即通知人人文库网,我们立即给予删除!