齿轮.dwg
齿轮.dwg

板材坡口机的总体结构设计【7张CAD图纸+毕业论文全套】

收藏

压缩包内文档预览:
预览图
编号:438019    类型:共享资源    大小:525.71KB    格式:RAR    上传时间:2015-06-01 上传人:好资料QQ****51605 IP属地:江苏
45
积分
关 键 词:
板材 坡口机 总体 整体 结构设计
资源描述:

摘要


本文旨在探索板材坡口机的总体结构设计,即板材坡口机的设计,又称板材坡口机设计。当前我国板材坡口机技术已经有了一定的发展,而且逐渐趋于自动化。

本文根据板材坡口机的工作原理和基本结构,初步设计板材坡口机。在此基础上通过对此题目的分析以及对一些相关书籍和文献的查阅,进一步研究了板材坡口机的总体结构设计。本文所设计的板材铣边用于电厂中铝板焊接前的坡口成型,板材坡口机的设计重点应在于液压系统和板材坡口机的铣削系统的设计。已完成的主要工作可以概括为以下四方面:

1.对课题的来源、选题的目的、以及板材坡口机在国内外发展的形势及所存在的问题进行了相关的论述。

2.阐述了板材坡口机的一般结构,然后根据自身的需求选取适当的结构组件。简易的叙述了总体方案设计。

3.对液压系统的基本概念、特点、应用以及基本工序做了简要的介绍,进而分析了板材坡口机技术的现状和发展方向。

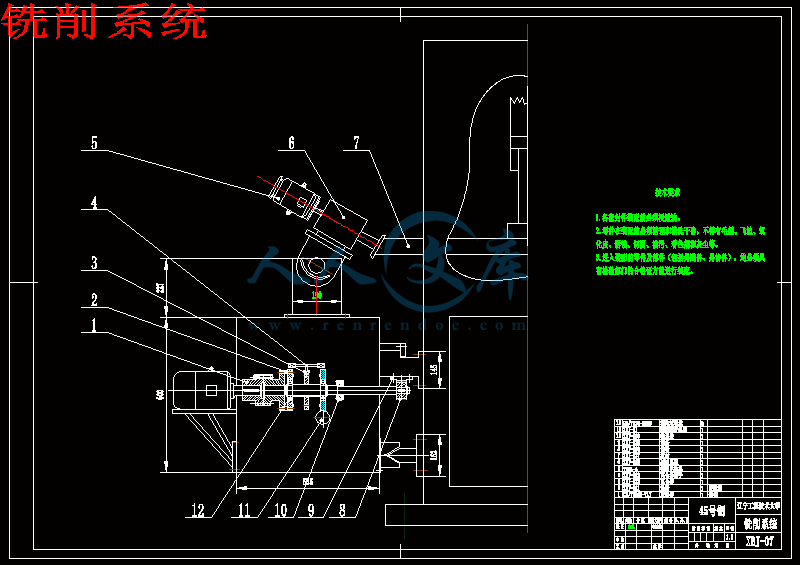
4.对本设计的重点-板材坡口机的铣削系统进行设计。分析了铣削控制系统的过程,进而对铣削件进行了工艺分析,为板材坡口机铣削系统设计奠定了基础,最后对板材坡口机铣削系统重要的各个尺寸参数进行了校核。

本文通过研究设计板材坡口机的基本原理,获得了大量有关设计板材坡口机的要领。论文的完成对进一步完成生产性设计和探索设计板材坡口机过程有一定的参考价值。

关键词:坡口机;剪板机;传动;液压;自动化


Abstract


This article thesis is aimed at exploring the overall structure design of plate edge milling machine, that is the design of plank stuff edge milling machine, also called the design of board groove machine.At present,the design of plank stuff edge milling machine already has the certain development,and gradually tends to automation.

According to the principle of work and basic structure of plank stuff edge milling machine,the present thesis designs the plank stuff edge milling machine.On the base of these works,  through regarding this topic analysis and consulting to some correlation books and literature, were further make clear that the overall design of plank stuff edge milling machine. This present thesis designs the plank stuff mill uses in the power plant before thealuminum sheet welding bevel to take shape. Designs should lie in with emphasis the design of the hydraulic system and milling system .

The main work achieved are summed up as following:

1.The related summary was made on the source and goal of task , Domestic and foreign development situation,existence problem.

2.The related summary was made on the general structure,then according to own demand selection suitable structure module.And a simiple narration was made on the overall design of plank stuff edge milling machine.

3.The related summary was made on the basic concept,characteristic,application and essential working procedure,and was further analysis the present situation and development direction.

4.The related summary was made on  this design key point-milling system. Analysis was made on milling control system,and was further craft analysis the  milling components.this has laid the foundation for the milling system of plank stuff edge milling machine.Finally,it has carried on the examination on each improtant size parameter of plank stuff edge milling machine.

In this paper a lot of experimental data about main point of plank stuff edge milling machine were acquired by studying the basic principle.This paper also will provide guidance for industrialization and researching  plank stuff edge milling machine process.

Keywords: plank stuff edge milling machine; board groove machine; guillotine shear;transmission; hydraulic pressure;automation


目录


前言1

1 绪论2

1.1 课题来源2

1.2 课题的设计目的及意义2

1.3 与课题相关的国内外研究现状分析2

1.3.1 板材坡口机在国内的发展情况2

1.3.2  板材坡口机在国外的发展情况4

1.3.3  对板材坡口机行业在国内发展的建议5

1.4  刨边机与坡口机的优缺点6

1.5  铣边与剪边工艺的比较7

1.5.1板边加工在焊接工艺中的必要性7

1.5.2  板边加工工艺常用的带钢板边加工工艺7

1.5.3  圆盘剪剪边工艺7

1.5.4  粗铣+精铣工艺8

1.5.5  单台铣边工艺8

1.5.6  圆盘剪剪边+单坡口机铣边工艺8

1.5.7  板材焊接质量好8

1.5.8  板材成材率高8

1.5.9  易加工厚板9

1.5.10  铣边坡口参数9

1.5.11  铣边工艺对工作条件的要求9

1.5.12  存在问题10

1.5.13  结论10

1.6  主要设计内容和预期结果11

1.6.1  设计内容11

1.6.2  预期结果11

2  板材坡口机的总体结构概述12

2.1 板材坡口机的结构12

2.2板材坡口机的总体方案设计13

3 控制系统的选择及设计14

3.1 控制系统的选择14

3.2 液压传动系统的设计14

3.2.1 液压缸主要参数的确定14

3.2.2 缸筒壁厚和外径计算15

3.2.3 液压缸的强度校核16

3.3 液压元件的选择18

3.4 液压系统的性能验算20

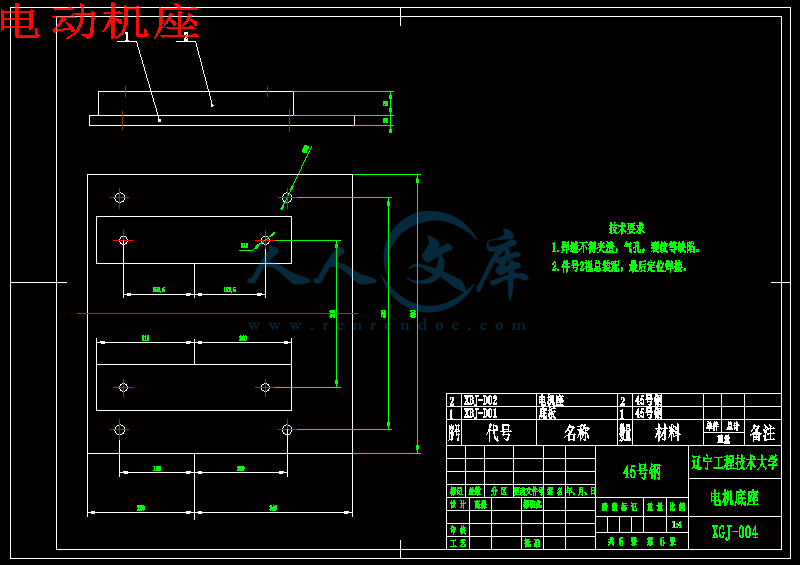
4 板材坡口机铣削系统设计21

4.1 电动机的选择21

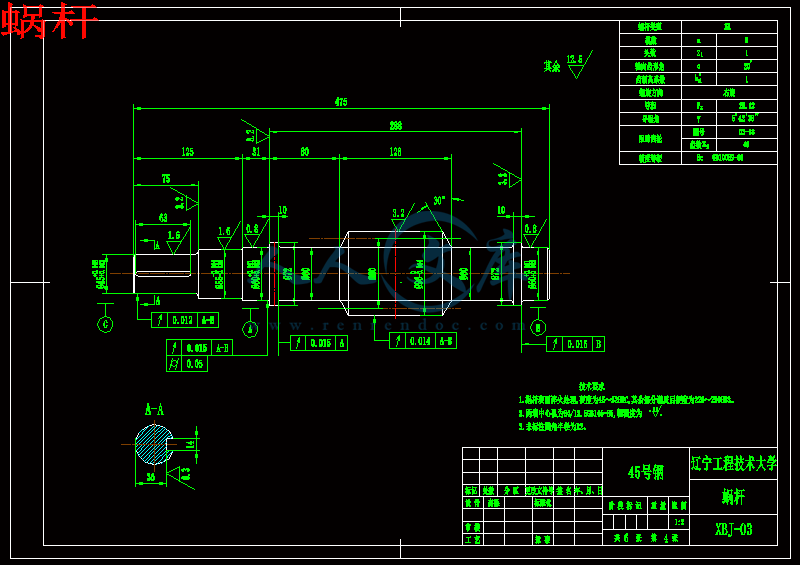
4.2轴的设计21

4.2.1轴的转矩强度计算21

4.2.2  轴的结构设计21

4.3  齿轮的选择及计算23

4.4  导轨的设计24

4.4.1  导轨的功用24

4.4.2 直线运动导轨的特点24

4.4.3  普通滑动导轨的特点24

4.4.4   V型导轨的选用25

5 经济性分析26

6  结论27

致谢28

参考文献29

附录A30

附录B38


内容简介:
辽宁工程技术大学毕业设计(论文)摘要本文旨在探索板材坡口机的总体结构设计,即板材坡口机的设计,又称板材坡口机设计。当前我国板材坡口机技术已经有了一定的发展,而且逐渐趋于自动化。本文根据板材坡口机的工作原理和基本结构,初步设计板材坡口机。在此基础上通过对此题目的分析以及对一些相关书籍和文献的查阅,进一步研究了板材坡口机的总体结构设计。本文所设计的板材铣边用于电厂中铝板焊接前的坡口成型,板材坡口机的设计重点应在于液压系统和板材坡口机的铣削系统的设计。已完成的主要工作可以概括为以下四方面:1对课题的来源、选题的目的、以及板材坡口机在国内外发展的形势及所存在的问题进行了相关的论述。2阐述了板材坡口机的一般结构,然后根据自身的需求选取适当的结构组件。简易的叙述了总体方案设计。3对液压系统的基本概念、特点、应用以及基本工序做了简要的介绍,进而分析了板材坡口机技术的现状和发展方向。4对本设计的重点-板材坡口机的铣削系统进行设计。分析了铣削控制系统的过程,进而对铣削件进行了工艺分析,为板材坡口机铣削系统设计奠定了基础,最后对板材坡口机铣削系统重要的各个尺寸参数进行了校核。本文通过研究设计板材坡口机的基本原理,获得了大量有关设计板材坡口机的要领。论文的完成对进一步完成生产性设计和探索设计板材坡口机过程有一定的参考价值。关键词:坡口机;剪板机;传动;液压;自动化 AbstractThis article thesis is aimed at exploring the overall structure design of plate edge milling machine, that is the design of plank stuff edge milling machine, also called the design of board groove machine.At present,the design of plank stuff edge milling machine already has the certain development,and gradually tends to automation.According to the principle of work and basic structure of plank stuff edge milling machine,the present thesis designs the plank stuff edge milling machine.On the base of these works, through regarding this topic analysis and consulting to some correlation books and literature, were further make clear that the overall design of plank stuff edge milling machine. This present thesis designs the plank stuff mill uses in the power plant before thealuminum sheet welding bevel to take shape. Designs should lie in with emphasis the design of the hydraulic system and milling system .The main work achieved are summed up as following:1.The related summary was made on the source and goal of task , Domestic and foreign development situation,existence problem.2.The related summary was made on the general structure,then according to own demand selection suitable structure module.And a simiple narration was made on the overall design of plank stuff edge milling machine.3.The related summary was made on the basic concept,characteristic,application and essential working procedure,and was further analysis the present situation and development direction.4.The related summary was made on this design key point-milling system. Analysis was made on milling control system,and was further craft analysis the milling components.this has laid the foundation for the milling system of plank stuff edge milling machine.Finally,it has carried on the examination on each improtant size parameter of plank stuff edge milling machine.In this paper a lot of experimental data about main point of plank stuff edge milling machine were acquired by studying the basic principle.This paper also will provide guidance for industrialization and researching plank stuff edge milling machine process.Keywords: plank stuff edge milling machine; board groove machine; guillotine shear;transmission; hydraulic pressure;automationIII辽宁工程技术大学毕业设计(论文)前言板材坡口机是一种使用最广泛的板材加工机械,早已实现了液压化,80年代迅速实现了数控化。据不完全统计,CIMT95展出了18台板材坡口机,其中外国7台,中国11台。除了中国台湾的一台以外,其余的17台全部是数控板材坡口机。在我国历届国际机床展览会上,这一届展览会展出的板材坡口机最多,国产板材坡口机也很多,且水平较高。板材坡口机是用于焊接板材前打坡口的机械。对于普通板材坡口机来说,只有高度熟练的操作人员才能做好此工作,即使如此也需要相当长的调整时间。用先进的液压系统和数控系统装备的板材坡口机不但可以大大缩短调整时间,而且没有工作经验的操作人员也能生产出达到要求的板材坡口机。本文研究的板材坡口机用于铝板的坡口加工,具有很好的实用价值,这种板材坡口机控制系统由液压系统控制,铣削系统为核心系统。相对数控系统装备的板材坡口机其成本要低的多,而且对操作人员的熟练度要求较低。本文主要阐述了铣削系统、液压缸的设计以及液压控制系统的设计等内容。1 绪论1.1 课题来源阜新封闭母线有限责任公司(原阜新封闭母线厂)是国家定点设计,制造封闭母线及其成套设备的专业企业,是中国最早研制、生产全连式相对封闭母线的厂商,拥有八十年代世界先进水平的封闭母线铆焊生产设备和2.5万安培大电流实验装备,是东北输变电上市公司之一。板材坡口机是封闭母线生产中不可缺少的设备,为满足客户的需求,公司迫切需要设计一种实用且成本较低的产品。1.2 课题的设计目的及意义随着板材坡口机控制系统的发展,它的功能越来越齐全,操作越来越方便。虽然以数控系统为控制系统的板材坡口机生产效率会很高,而且质量也非常好,但这些对于铝板的坡口加工来说,消耗的成本过高,固我们采取常用的设计结构,使用液压控制系统进行设计。这样不但能满足生产要求还能节省资金。1.3 与课题相关的国内外研究现状分析1.3.1 板材坡口机在国内的发展情况近年来,继液压技术之后,数控技术广泛应用于锻压机械的各个领域,国内的数控板材坡口机也有一定的发展。从1986年10月第一台XBJ67Y-160K/3200数控板材坡口机由天水锻压机床厂研制成功以为,国内数控板材坡口机技术发展较为有代表性的单位有济南铸造锻压机械研究所、黄石锻压机床厂和上海冲剪机床厂。黄石锻压机床厂和济南铸造锻压机械研究所联合先后完成了XBJ67K-100/3000和XBJ67K-100/3100S型数控板材坡口机。其中XBJ67K-100/3100S板材坡口机产品属于70年代末开发的新型板材坡口机。上海冲剪机床厂更是异军突起,从1986年以来先后开发成功具有现代水平的XBJ12K与XBJ67K两大系列数控板材坡口机和具有当代水平的高精度数控板材坡口机。其中XBJ67K系列数控板材坡口机采用瑞士CYBELEC CNC7200P板材坡口机专用数控系统,该系统可通过X轴(后挡料位置)、Y轴(机械挡料位置)来控制坡口角度,并由当栅尺检测出滑块位置,由CNC来控制滑块上下死点、快慢速度换点和板料压紧点等。不甘落后的上海新力机器厂奋起直追,1992年下半年起先后研制成功了XBJ67K系列数控板料折弯机,其中XBJ67K02-100/3200数控板材坡口机采用台湾心得科技公司生产的CD-SERVO1702型数控系统,采用二轴切换方式实现二轴的分别控制和定位。该数控板材坡口机属于经济型,整机性能稳定、可靠、操作简便,该机已销往海内外。另一种XBJ67K100/320数控板材坡口机的数控系统采用上海机床研究工作所开发的MTC-1B型,该系统相当于瑞士CYBELEC公司的CNC7200P,具有80年代先进水平。该厂最新研制的XBJ67K22-100/3200数控板材坡口机,采用瑞士DNC73PCG-b数控系统。该系统可用英语进行人机对话编程,并控制折弯铣削力,配有9in高分辨率显示屏幕,输入各铣削角度后可显示所铣削产品的单色图象,直观地提示操作工人应如何进行操作,滑块位置由沅栅尺检测等等。另外,我国最近又研制成功了XBJ67K-DNC系列三种数控板材坡口机,该系统板材坡口机采用瑞士Cybelec DNC7200型数控系统。该机具有如下特点:图形显示功能和计算机辅助编程功能(CAP),即操作者根据加工图纸,将铣削角度和铣削边缘的长度输入后由DNC显示工件的截面图,并计算所需工件展开长度;引用存储器里的模具参数等计算最佳铣削顺序和每道顺序的定位尺寸;压力计算功能可以计算自由铣削及凹模铣削所需压力;在圆弧铣削计算功能,用直线逼近方式模拟大圆弧铣削加工,计算每一工序的定位尺寸;辅助参数计算机功能,如计算滑块的上死点位置,由DNC连续控制协助操作能避免错误动作。在CIMT展出的产品中,国产板材坡口机较多,而且水平较高。下面简单介绍几个公司的展品:1)上海冲剪机床厂展出的XBJ67K-160/3200型板材坡口机,两个油缸各自采用电液伺服闭环控制。采用Cybelec公司Press Cad900数控系统,实现7轴数控(Y1、Y2、X2、R、Z1、Z2)。滑块上有长孔,布置液压挠度补偿装置。上模有液压快速夹紧装置,工作台前有气动前托料架。2)新力机器厂展出的XBJ63K37-100/3100型板材坡口机,两个油缸各自采用电液比例闭环控制。采用Cybelec公司Press Cad900数控系统实现7轴数控制(Y1、Y2、X1、X2、R、Z1、Z2)。工作台上有液压挠度补偿装置。上模有液压快速夹紧装置。该厂现有3个系列数控板材坡口机,K24系列为电液伺服闭环控制,采用Cybelec DNC70或DelemDA-24数控系统,4轴数控。K02系列和K22系列是2轴数控,主机为扭轴机械挡块结构,前者用心得公司BD-100数控系统,后者用Cybelec DNC 73PGG-6数控系统。3)亚细亚机械有限公司展出的XBJ-100/3100型板材坡口机是按瑞士Beyeler公司的图纸生产的,两个油缸各自采用比例阀和光栅组成的电液比例闭环控制,但是光栅的动尺和定尺直接装在床身和滑块上,而不是在工作台两端各装一C型臂,与动尺连接。这样不能消除加载时和偏载时床身变形不一致对铣削精度的影响。采用Cybelec数控系统,实现3轴数控;Y1、Y2、X。数控系统不是悬挂式箱形结构,而是与电气控制柜装成一体。该公司是日本亚细亚国际商事株式会社在中国开设的工厂,而亚细亚国际商事株式会社是Cybelec公司的亚洲总代理。Beyeler公司是瑞士生产板材坡口机的著名公司,板材坡口机的规格从500N到50000KN,工作台最大长度18000mm。据称最近制造了世界100000KN板材坡口机,用于海上石油钻井平台板材的铣削。4)江都机床总厂展出的XBJ67K-160/4000型板材坡口机和扬州锻压机床厂展出的XBJ-PB12A-125/3200型板材坡口机,都是用电液比例控制系统对两个油缸进行闭环控制。前者采用Delem DA-24e数控系统,4轴数控:Y1、Y2、X、R。工作台上有液压挠度补偿装置。后者采用Cybelec DNC70数控系统,3轴数控;Y1、Y2、X。5)北京锻压机床厂展出XBJ67K-63/2500型板材坡口机,天水锻压机床厂。无锡治金机械厂和靖江锻压机床厂各殿出XBJ67K-100/3200型板材坡口机。主机者是扭轴机械挡块结构。采用DelemDA-24或Cybelec DNC70数控系统,2轴数控:Y和X。6)台湾晔俊公司展出的XBJ6020型板材坡口机,铣削力600KN,工作台长度2000mm。主机采用齿轮齿条同步机构,操纵盒子上有滑块位置调节和显示装置,是普通板材坡口机。该公司也生产数控板材坡口机,铣削力从450KN到3000KN,工作台最长长度3600mm,共20种规格。我国板材坡口机技术水平近年来得到迅速提高,在CIMT展出的10台板材坡口机全部数控化,使板材坡口机的精度、功能和可靠性提高到了一个新阶段。1.3.2 板材坡口机在国外的发展情况国外的板材坡口机早已实现液压化,现在已普遍采用电液比例(或伺服)控制技术对两个油缸的同步位置,速度和压力进行精确控制。与机械液压伺服阀的液压系统相比,不仅调整方便,控制精度高,容易实现双机联运,而且机械结构简单。液压系统集成化,与数控系统连接简单方便,从而使板材坡口机的制造、装配、调试和维修的工作量都相应减少。国外著名的液压件公司如Rexroth、Bosch等都可全套提供板材坡口机的比例控制液压系统,其控制阀块(包括充液阀)直接装在油缸顶部,使液压管路减少到最佳程度。著名的Cybelec、Delem、Autobend等公司可以提供板材坡口机专用的各种档次的数控系统。上述液压系统和数控系统全都可以匹配,为板材坡口机制造厂提供了极大的方便。为了进一步提高铣削精度,国外有些板材坡口机公司已开发了多种板料厚度自动测量装置、铣削角度自动测量装置、铣削角度回弹量自动测量及补偿装置,并已经在板材坡口机上得到实际应用。为了减轻板材铣边操作的劳动强度,实现无人操作,已有几家板材坡口机公司开发了多轴数控的专用机器人与板材坡口机公司开发了多轴数控的专用机器人与板材坡口机组成“板材坡口机机器人”系统,在生产尺寸较小,形状不太复杂的典型板材铣边件时实现无人操作。CNC在国外板材坡口机已经普遍应用,如瑞典Pullmax公司的Ursviken分部每年大约生产200台板材坡口机,其中90%以上的产品装有CNC。该公司OPTIM型640KN CNC板材坡口机采用Cybelec 公司KNC900数控系统。该公司另一种新式的板材坡口机具有伺服控制(带有偏心铣削功能),铣削过程中可以补偿机身变形的“双工作基准面”,重复精度可高达0.01mm。多轴控制所具有的多性能使板材坡口机实现有效控制,悬浮结构和液压模具夹紧装置实现模具自动快速换模,并装有板料的测厚装置,用以检查铣削板的厚度变化是否在板材坡口机的允许范围之内。Adira的XBJ-DNC系列全电液压系统控制的上传动板材坡口机,采用Cybelec DNC33P6系统,全部实现DNC控制。美国的Pacific Press & Shear公司的CNC三点板材坡口机,在工件铣削精度和机器操作方面都另具特色。而瑞士的Hammarler公司AP系列三点板材坡口机更是80年代冷加工设备的佼佼者,它不仅有数控或程序控制功能,并较好地解决了金属板料铣削的高质量和高重复精度问题。因此,在多层次金属板料铣削过程中,工件精度几乎不受工件长度的影响。国外还有由机器人和板材坡口机组成的柔性板材坡口机系统,用于实现折柔性铣削。如日本天田公司5500KNFDB型精密板材坡口机和意大利普利玛公司设计的由机器人组成“板材坡口机机器人”系统。机器人装在板材坡口机的工作台上,沿工作台移向自动叠料机,以钳爪夹住一块板料(板料已升起到与夹钳相同的水平面上),回到其工作位置,操作板料直到完成全部铣削工序为止,然后再回到自动叠料机处卸下已成形的工件并夹起另一块板料。1.3.3 对板材坡口机行业在国内发展的建议如今我国的板材坡口机技术水平已经提高到了一个新阶段,但是我国板材坡口机行业需要进一步发展和提高,应该重视以下问题。1)板材坡口机制造厂必须尽快建立一支能够熟练掌握板材坡口机数控系统和电液比例控制系统的技术队伍。为了使数控板材坡口机作为商品进入市场,让用户正常使用,各板材坡口机制造厂一定要拥有能够担当起数控板材坡口机的设计、装配、调试、维修和培训用户任务的技术人员和工人的队伍。2)国内板材坡口机的规格品种很少,龙其缺少大规格大吨位板材坡口机。大多数板材坡口机都没有上下模的液压快速夹紧装置、工作台挠度补偿装置、气动托持装置、多种型式的后挡料器等可供用户选择的部件和附件。3)大量使用金属薄板的用户,往往配套使用“冲剪折”三大件板料加工设备。因此,生产板料成形机床的制造厂正向“冲剪折”三大件产品成龙配套生产的方向发展。在国外这一趋势早在几年前就已出现。我国有条件的板材坡口机制造厂应该不失时机开发冲模回转头压力机或步冲压力机。4)外国著名的公司大举涌入中国的板材坡口机市场,除了一些早已进入的公司以外,近两年又有一批公司或在中国建厂生产,或建立办事处、经销机构,或与国内工厂洽谈合资,一些首次来中国参展的公司也在积极寻找代理销售服务单位。这对我国板材坡口机行业是一个严峻的挑战。另一方面,为板材坡口机提供数控系统、液压系统,以及光栅尺、伺服电机等配套件的许多外国公司也正在积极争夺中国市场,为迅速提高我国板材坡口机的水平提供了有利条件。一些外国板材坡口机公司也正在中国谋求技术合作、合资生产,也为我们提供了机遇。因此,面对这一挑战与机遇、困难与有利条件并存的局面,我们必须抓住机遇,迎接挑战,迅速提高和发展我国自己的板材坡口机技术。1.4 刨边机与坡口机的优缺点刨边机的优缺点:(1) 刨边机价格便宜,便于制造,寿命较长(2) 刨刀更换方便(3) 刨刀仅能刨出V 形焊接坡口(4) 刨边机为被动切削,无需动力,但消耗递送机的递送力(5) 刨刀需磨削,对工人磨削技术要求高(6) 刨边机无法消除钢带月牙弯(7) 刨边刨出的边缘形状不精确一致(8) 刨边机很难同时刨出钢带两侧形状,无法保证钢带宽度一致(9) 刨边机对圆盘剪剪切后的钢带两侧质量要求较高,圆盘剪出现弦崩刃时必须更换。坡口机的优缺点:(1) 坡口机铣出的坡口形状精确一致,有利于成型和焊接,是焊接的理想坡口,尤其是厚板时能铣出理想的X 型坡口(2) 坡口机铣出的坡口角度准确,从始到终不变,可避免成型缝“内紧外松”或“外紧内 松等缺陷(3) 铣出的边缘及坡口的表面粗糙度好,减少了错边、烧穿、电流和电压波动等缺陷(4) 可消除的部分月牙弯,对头通过平稳(5) 在厚度大于12 mm 时,可铣出X 型坡口,避免未焊透现象,且可有效降低焊缝高度,得到理想的焊缝形状,并有利于钢管内外表面的防腐作业(6) 可在两侧同时铣出焊接坡口,有利于成型稳定,并保证钢带宽度不变(7) 坡口机为主动切削,需一定的动力(8) 铣边刀片更换时较费事(9) 坡口机的振动及噪音较大1.5 铣边与剪边工艺的比较板边加工是焊接生产工艺中必不可少的工序,焊接的质量和经济效益与待焊板边质量、加工宽度关系密切。采用坡口机铣边工艺代替传统的圆盘剪边工艺,可根据板厚加工成要求的钝边尺寸、粗糙度和需要的焊接坡口,为焊接板材创造良好的条件。加之铣边量比剪边量窄,提高了成材率,具有良好的经济效益。1.5.1 板边加工在焊接工艺中的必要性GB /T14164标准规定:“不切边板材宽度允许偏差为+ 20mm; ”“不切边板材的镰刀弯每5m不得大于25mm。”为了保证板材成型稳定及焊接质量,必须对板材进行板边加工,以消除“镰刀弯”,并使其达到所要求的工作宽度。板材板边质量决定了焊接内在质量。为了保证焊接质量,必须去除板边氧化物、油及其它缺陷,且板材边也不允许凹凸不平。为了易焊接(小规范) 、提高焊速、焊缝内无未焊透,在板厚较薄时应防止板材边挤厚,在板厚较厚时应加工出所要求的焊接坡口及钝边等。因此, 板材板边加工是焊接工艺必不可少的工序,板边加工工艺多种多样,采用合理的板边加工工艺既可提高焊管质量又可提高成材率。1.5.2 板边加工工艺常用的带钢板边加工工艺 圆盘剪剪边工艺前后两台坡口机粗铣+精铣工艺单铣边工艺;圆盘剪剪边+坡口机铣边工艺1.5.3 圆盘剪剪边工艺圆盘剪剪边工艺是传统的板边加工工艺,采用上下两个圆形剪刃,根据板材厚度,通过调整两个剪刃间的间隙、重合量,将板边切除,剪边宽度一般为11. 2 t ( t为板厚) 。切除后的板边质量与剪刃质量、间隙、重合量密切相关,三者缺一不可。圆盘剪剪边工艺是剪切与撕裂共同作用,其板边形状凹凸不平 、或向一面翅边、或板边与板面垂直方向有小夹角 ,易造成气孔、漏弧以及ERW 焊管熔融氧化物难排出等焊接缺陷。剪边工艺造成的板边形状优点是剪刃调整好后使用周期较长,作业率高,刀盘消耗较低。1.5.4 粗铣+精铣工艺目前应用最普遍的铣边工艺为粗铣+精铣,粗铣机用直刀铣头将板材板边氧化物及缺陷铣去,并保证要求的工作宽度。精铣用X或Y形刀头将板边铣成所要求的坡口形状。此工艺适合生产厚壁板材,但刀具损坏较快,最多用8 h必须更换一次刀头,相对作业率偏低。在生产薄壁板材而且原料宽度变化小时,可用一台坡口机,另一台备用,以减少更换铣刀耽误的时间。1.5.5 单台铣边工艺只用一台坡口机,同时完成粗铣和精铣工序,既要将板材铣到成型所要求的工作宽度,又要将板边铣出焊接所要求的粗糙度及坡口形状。单铣的条件为原料宽度偏差要小(10mm以内) ,否则,料窄时会造成板边氧化物等缺陷未清除,料宽时会造成打刀或将刀盘卡死。此工艺适合生产薄壁、原料宽度变化小的板材。1.5.6 圆盘剪剪边+单坡口机铣边工艺此工艺综合了圆盘剪剪边和坡口机铣边工艺各自的优点,圆盘剪剪去原料变化大的边缘部分,坡口机铣到所要求工作宽度、坡口形式和钝边,在原料宽度变化大时会发挥更好的作用,但整体设备成本高。1.5.7 板材焊接质量好由铣边、剪边工艺及焊接对板边质量要求分析可以看出,铣边后, 板材板边粗糙度大大改善,待焊表面平整,可铣出所要求的焊接坡口形式,易满足焊接所要求的条件。所以,经铣边后板材的焊接质量明显优于剪边后板材的焊接质量。1.5.8 板材成材率高板材成材率与板材宽度、板边状态、成型质量、内外焊质量、对头切除长度等有关。板材宽度一定时,工作宽度与板边加工工艺有关。用剪边工艺时,剪边单边宽度为11. 2 t,一般单边为715mm,双边为1530mm。壁厚增加,剪边宽度就要加宽,用剪边工艺影响成材率约在1%2%。而用铣边工艺铣削量与壁厚关系不大, 一般双边小于10mm, 影响成材率约0.7% ,即铣边比剪边节省材耗0. 3%1. 3%。1.5.9 易加工厚板在剪切小于8mm板厚时,板边质量受圆盘剪间隙、重合量及剪刃磨损影响,会造成板边毛刺、剪切面粗糙、凹凸不平等现象,而铣边不会产生这些现象。在剪切大于10mm壁厚时,剪切难,板边质量更差,而且不能加工焊接所需的坡口。所以剪边同铣边相比,会造成焊接质量差、焊接缺陷多、焊缝通过率低、成材率低等问题。1.5.10 铣边坡口参数(1)坡口形式在焊接壁厚大于10mm以上尤其是厚壁工件时,必须开Y、U、X形坡口给焊接提供方便。在坡口机铣削坡口的埋弧自动焊接中,采用Y、X形坡口形式。板材壁厚小于11mm时多用Y形坡口;壁厚大于11mm时用X形坡口。(2)坡口角度为了消除未熔合(坡口暴露在焊缝边) 、假咬边等焊接缺陷,在埋弧焊接中坡口角度不宜过大,一般(单边)小于30,钝边可根据板厚度确定,应小于7mm。随着厚度增加,钝边可适当减小,以不漏弧、易观察内焊不造成焊偏为目的。在大壁厚(15mm以上板材焊接时,为了易于观察内焊红线,可将外焊坡口适当加大,但不宜超过 45。(3)坡口位置内焊开坡口有利于熔深,因为内焊时,待焊金属温度为室温,温度较低。外焊受内焊的预热,在同样条件及线能量下,外焊比内焊熔深大。内焊为双丝焊时,内焊开坡口是最合理的,有利于跟踪内焊避免焊偏,同时降低内焊道高度;但在内焊为单丝时,为了防止假咬边,应尽量不要在内焊边开坡口或根据情况开小角度坡口。外焊开坡口一方面增加熔深,另一方面降低焊缝高度,减少应力集中,也有利于钢管外防腐,这一特点被公认。但焊接时,不易于目测跟踪内焊红线,而造成内焊焊偏。1.5.11 铣边工艺对工作条件的要求(1)对板材质量的要求不同板材生产厂质量控制、生产工艺及设备的差异,生产的板材板形不同,即板宽公差、月牙弯、平直度差别较大。板形太差铣边时易产生脱铣、打刀等现象,给铣边带来困难。同生产厂签定技术条件时,必须对板形提出严格的技术要求,而且板边缘夹渣等内部缺陷范围不得大于铣边量,以保证铣边质量和焊缝质量。若采用圆盘剪+铣边工艺,可适当放宽对板形的技术要求。(2)对板材递送的要求(板材纠偏)在铣边时,为了防止一边脱铣而另一边铣削量过大,造成卡住坡口机、打刀等现象,对板材进行纠偏显得更为重要。板材纠偏主要以原料进入平辊、立辊交替分布区前,时刻保证板材按要求位置运行。若焊接机组为短流程(前摆式)机组,从拆卷机开始控制;若是有活套或有飞焊小车的连续生产机组,在板材进入坡口机前必须使板材按要求位置递送,从拆卷机开始保证板材递送,铣边效果肯定更佳; 板材在进入夹送机前出现不平(一高一低) ,或板材在进入成型机前出现跑偏时,调整夹送机某边压下量是消除上述问题的最佳方案。用立辊强制赶料会造成板材边缘挤厚,且易使立辊损坏。(3)对板材对头焊接的要求(对头质量)一般情况下,板卷的头、尾各项质量指标较差,需剪去一段长度后进行对头焊接。若操作工人操作不慎,会造成对头前后板材对不齐,增加硬弯(月牙弯) 、对焊错边等缺陷,给铣边带来麻烦。所以必须提高对头焊工操作水平,减少人为因素,防止料头料尾切斜造成对头前后月牙弯,为铣边质量提供保证。1.5.12 存在问题(1)消耗成本较高。用坡口机代替圆盘剪需要的电能、铣刀消耗比圆盘剪费用大,生产成本费用增加。(2)作业率降低。圆盘剪剪刃使用周期较长,而铣刀最多用8 h就需更换一次,每次更换时间约需30min,使作业率明显降低。1.5.13 结论(1)铣边质量高于剪边质量,并可铣出所要求的坡口,为焊接创造有利条件,提高了焊接质量。(2)采用铣边工艺,虽因刀刃磨损快、换刀频繁而增加了材料消耗成本,降低了作业率;但铣边量比圆盘剪剪边量小,可提高成材率约1%,综合经济效益可观。(3) 板材板形、生产工艺、操作水平是保证铣边质量的关键。(4)随着板材生产厂轧制技术的不断发展, 板材尺寸精度得到有效提高,焊接板材生产中板边以铣代剪工艺将广泛普及。1.6 主要设计内容和预期结果1.6.1 设计内容1)板材坡口机的总体结构设计2)液压系统(包括液压缸)的设计3)板材坡口机的铣削系统设计4)控制系统概述1.6.2 预期结果能够设计出一台满足阜新封闭母线厂需要的液压铜排(铝排)板材坡口机,并能提高一定的生产率和产品质量,减轻工人劳动强度,降低生产成本。2 板材坡口机的总体结构概述2.1 板材坡口机的结构由于铣边工艺的特殊性决定了板材坡口机的结构与普通压力机结构上的差异。通常所有板材坡口机由以下几部分组成:1)油缸:提供板材坡口机压紧板材所需的压紧力且驱动压料脚上下往复运动。2)压料脚:在长度上连接液压缸,可上下往复往复运动,完成板料的压紧。 3)机架:由两个立柱及三梁联结而成。油缸、机床导轨及铣削系统等均固定在其上。两个立柱是最主要受力构件。4)带滚轮的板料的工作台。5)铣削系统:由铣削头,工作进给系统,快速滑移系统等组成。6)液压系统:由油箱、油泵、压力阀组、同步阀组及液压管道等组成。向油缸提供压力油并控制其运动。8)减速器:连接电动机和铣削头,使铣削头具有变速功能。9)主电动机和三个辅助电动机。10)其它辅助功能机构:便于板料的上、下料及折弯过程中的随动托料,可实现自动化。总体设计要求坡口机在属于高精度设备,设计时需按有关机床设计标准设计。根据我对坡口机的研究与设计,以及在焊管生产线上的应用情况,对设计要求作介绍:坡口机的动力传递推荐采用齿轮传动,选用高精度齿轮,尽量减少电动机振动、跳动等对主轴精度的影响;铣头应设计成角度可调,以便铣出理想的焊接坡口;要有效解决板材的左右窜动和上下跳动难题,从而避免打刀现象;铣刀盘要有防护,防止铁屑飞溅到钢板上和操作人员的身上,以免造成钢板表面压痕和人身不安全事故发生;主轴箱需要稀油润滑,用于保证轴承润滑;为了保证刀具的耐用度,必须合理确定铣削速度。由于国内刀片质量及研究水平的提高,刀片的切削速度已有很大的提高。建议坡口机刀片尽量采用硬质合金刀片,切削速度在150260 m/ min。(2) 刀片坡口机必须适用于连续作业生产,要求刀片具有很高的抗热震裂、抗塑性变形能力和抗冲击性,红硬性高,耐磨性好。并要求更换方便、快捷,一个刀片有多个刃口可供使用。(3) 顺铣与逆铣铣刀旋转的方向与前进的方向相同称为顺铣;铣刀旋转的方向与前进的方向相反称为逆铣。顺铣切削时,刀齿一开始就从最大的切削厚度处切入,逐渐切到零,避免了在已加工的板材边缘表面上滑行,减少了加工表面冷作硬化现象和后刀面磨损,而且切削路程短,铁屑短粗,平均切削厚度大,变形小,切削功率可比逆铣节约10 %左右。逆铣切削时,每齿切下的铁屑切削厚度是逐步从零增至最大。因此刀齿刚切入时,在钢带由前一刀齿切削所形成的冷硬表面层表面上滑行一段距离,直到切至一定的切削厚度时才能切入,而且进给量越小,滑行距离越长,所以刀齿后面与工件磨擦较大,挤压严重,使刀具易于磨损,耐用度和粗糙度降低,还会造成严重的硬化层。因此针对实际需要我设计的坡口机采用顺铣方式。对于阜新封闭母线厂所需要的,我们只需做一个简易的板材坡口机,设计的结构包括液压缸、铣削系统以及控制系统等。2.2 板材坡口机的总体方案设计总体方案设计包含功能设计、结构设计和性能设计三部分。功能设计,即在调研并确定了板材坡口机的工作参数(运动、动力、尺寸)之后,通过功能分解创新出或类比出可以实现加工要求的各种布局方案创新设计。通过对运动功能的分解和合成来确定其布局方案,对于设计加工特定板料的专用板材坡口机较为有效。而铣削设计或类比设计主要通过查询、比较确定可参照的板材坡口机布局方案,而大量用于设计一般的通用性板材坡口机。结构设计是在总体布局方案基本确定之后,对机械结构件进行主要形状和尺寸的设计。结构设计同样有类比和创新设计两类。类比技术是建立在成组技术和模块化技术的基础上,采用参数化设计方案来实现。而创新式设计主要是按照设计人员的意愿,通过对基础模块(板、梁、筋、孔、凸缘、法兰等)的实体进行拼装、重叠等操作来实现。性能设计是根据板材坡口机的总体性能要求对运动误差、精度和刚度等进行设计分配。 3 控制系统的选择及设计3.1 控制系统的选择控制系统的传动主要有机械传动、气压传动和液压传动等不同类型。机械传动是指依靠齿轮等一些机械机构来传递能量的传动;气压传动是以气体的压力能进行传递和转换能量的气体传动;液压传动是以液体的压力能进行传递和转换能量的液体传动。由于液压传动装置体积小、重量轻、结构紧凑、惯性小;操纵、控制简单,方便、省力;易于实现过载保护;液压元件使用寿命长,所以液压传动系统自然就成为首选。但液压传动也有其自身的缺点,如:液压传动的工作性能受外界条件的变化很大;容易产生泄漏和压力损失,传动效率低;易产生泄漏而造成污染;对液压元件的加工精度、材料的材质和热处理工艺、维护和检修水平等要求较高,故成本较高;对工作介质的过滤要求严格。虽然液压传动存在以上的一些缺点,但总的看来,该传动的优点多于缺点,故选用液压传动。3.2 液压传动系统的设计3.2.1 液压缸主要参数的确定根据手册10的推荐值,按主机类型选择工作压力,初选液压系统工作压力=2.2。1)液压缸缸筒内径根据液压缸的供油压力与负载缸筒内径D可按下列公式初步计算: (5-1)式中: 名义总压力 液压缸的供油压力,一般为系统压力 液压缸的机械效率,取=0.92)活塞杆直径查表,由工作压力=2.2,选取速比,公称压力为3。则活塞杆直径为:据手册调整D与d得:。3)液压缸工作循环中流量的计算当活塞杆伸出时 当活塞干退出时 式中:液压缸的容积效率,活塞密封为金属环,为0.98活塞杆伸出速度, 活塞杆退回速度, 液压缸内径活塞杆直径3.2.2 缸筒壁厚和外径计算1)缸筒壁厚的计算缸筒常用无缝钢管材料,本设计采用的是45号钢。缸筒相当于一个两端封闭的圆筒形受压容器,由材料力学可知,其应力状态是随着缸筒内径和壁厚的比值改变而改变,因此在计算缸壁的合成应力与厚度时,必须考虑不同的比值与材质,采用不同的强度公式。由于是事先未知的,因此需要假设和验算过程。表5-1 高精度冷拔无缝钢机械性能表Tab.5-1 Table of colddraw seamless steel mechanical properoty材料S45S35bN/mm2700600sN/mm2340310s%164EN/mm220900212000.2690.291a 先求薄壁缸筒当,强度计算公式: 式中: D缸筒的内径最高容许压力缸筒材料的许用应力 缸筒的内应力许用应力可以用下式计算: 式中:缸体材料的抗拉强度,查表可知 n安全系数,一般取5算出值后代入 取整mm由于,而0.04 0.08满足前面假设的条件,所以采用这种薄壁缸筒。2)缸筒外径缸筒的壁厚确定以后,由下式计算出缸筒的外径: 3.2.3 液压缸的强度校核以缸壁的厚度为参数,按照相应的公式确定液压缸有关尺寸:液压缸的缸体厚度: 缸体处过渡圆弧半径: 缸的出油口直径: 取整 mm 液压缸进行强度校核的有关数据为:FH23000N,缸体材料采用的是45号钢,材料的机械性能为,泊松比,液体工作压力为=2.2。此缸的主要尺寸为:缸的内径r16.5 缸的外径r27缸的缸底厚度t=1 缸的出油口直径d=1.7 1)缸壁部分此缸的最大应力点在内壁,其最大值为: 此时由于,所以安全。2)缸底部分本设计采用的是缸底为平底的,平底缸当作均步载荷作用且周边刚性固定的中心有孔的圆孔来考虑,最大弯曲应力发生在圆板的周边,可以按平板公式2计算: 式中:缸底因为开孔而引入的削弱系数此时许用应力取最小的值为100Mpa,由于,所以安全。3)活塞杆强度验算活塞杆常用35、45钢等材料,对于冲击震动很大的活塞杆,也可以使用55钢与40Cr。这里选用的是45 钢作为活塞杆材料。其力学性能为:,n 取22.5,则:=142177.5Mpa,取为177Mpa。活塞杆计算长度根据行程而定: l=S+L+H+(1020)=230+40+26+20=316 式中:S最大的行程,S=230 L导向套的长度,一般取活塞杆直径的0.6倍以上,即: H活塞杆插入活动横梁的长度,取H为由于,则按以下公式验算: 液压缸的最大推力为: 所以: 式中: 活塞杆直径 空心活塞杆内径,对于实心活塞杆 活塞杆的压或拉应力由于本设计中活塞杆直径d=61mmdmin=27mm,所以活塞杆满足强度要求。3.3 液压元件的选择1)选择泵和驱动电机取系统的泄漏系数8为K=1.1,则液压泵的最大流量为: 液压缸在整个工作循环中的最大工作压力为2.2,如取进油路上的压力损失为0,则考虑系统动态压力因素的影响,液压泵的额定工作压力为: 由于10个液压缸并联,所以: 根据和,查手册选用D7B-002型高压低噪声定量叶片泵,该泵的额定流量为4.725L/min,排量为6.3mL/r,公称压力为25。又因为该液压系统的最大功率出现在退回阶段,如果取液压泵的总效率为0.75,则液压泵驱动电机所需的功率为: 根据此数值查阅手册,选取Y160M型电动机,其额定功率,额定转速。2)阀类元件及辅助元件根据液压系统的工作压力和通过各个阀类元件、辅助元件的实际流量,可选出这些元件的型号及规格。表5-2给出了一种方案。滤油器:滤油器是用于滤除油液中非可溶性颗粒污染物,对油液进行净化,以保证系统工作得稳定和延长液压元件得使用寿命。所以液压泵吸油口需装一粗滤油器。表5-2 元件的型号及规格表Tab.5-2 Table of model and specification of element序号产品名称估计通过量(L/min)额定流量(L/min)额定压力(Mpa)产品型号123456定量叶片泵溢流阀三位四通换向滑阀单向阀单向阀背压阀54035320.54.72586340402025326321202010Y160MCYF-B4LHD-G(T)02AF3-E10BAF3-E10BP-D6B3)油管各元件间连接管道的规格按元件接口处尺寸决定,液压缸进、出油管则按输入、排出的最大流量计算。根据这些数值,当油液在压力管中流速取3m/s时,算得和液压缸无杆腔和有杆腔相连的油管内径分别为: 这两跟油管都按JB827-66选用内径16mm,外径18mm的无缝的钢管。4)油箱对于一般情况来说,油箱的有效容积(液面高度为油箱高度80%时的容积)可以按液压泵的额定流量估算出来。则: 式中: V油箱的有效容积 与系统压力有关的经验值:低压系统=24,中压系统=57,高压系统=1012。本设计中取=12。按GB2876-81规定,取最靠近的标准值V=80L。3.4 液压系统的性能验算1)回路压力损失计算由于系统的具体管路布置尚未确定,整个回路的压力损失值无法估算,仅阀类元件对压力损失所造成的影响可以看得出来,供调定系统中某些压力值时参考,这里估算从略。4 板材坡口机铣削系统设计4.1 电动机的选择根据车床上溜板箱的电动机选择,快移电动机选择型号为Y90S-4电动机。额定功率为1.1kw,转速为1500r/min。输出最大转矩为T=2.2工作进给电动机选择型号为Y802-4电动机。额定功率为0.75kw,转速为1500,输出最大转矩为T=2.24.2 轴的设计由于快移电动机的功率较大,所以在接下来设计轴的过程中,按快移电动机的功率和转矩进行计算。4.2.1 轴的转矩强度计算d 轴直径 mm。n 轴的转速 r/min。p 轴传递的功率 km。表5-3 几种常用轴用材料的及A值Tab.5-1 Table of several shaft materials轴的材料Q235-A,20354540Cr,35SiMn,42SiMn38SiMnMo,20CrMn/Nmm21220203030404052A16013513511811810710798根据实际需要,取35,d取45mm.轴的转矩强度校核:4.2.2 轴的结构设计轴段1 用于安装联轴器,其直径应该与联轴器的孔位相配合,因此要先选用联轴器。联轴器的计算转矩:KA 工作情况选 KA=1.5。T 电动机输出转矩。根据工作要求选用弹性柱销联轴器,型号为HL3,与输出联接的半联轴器孔径d1=45mm,半联轴器轮毂宽度L=112mm(J形轴孔)与轴配合的毂孔长度L=84mm。根据轴的直径选取轴承,取深沟球轴承36209。轴承宽度为19mm。所以轴段1的长度根据实际设计需要L1=27mm轴段2选用花键连接,根据轴的直径选小径为46mm,规格为846509的花键。根据实际需要花键长度定为115mm。花键联接强度计算:N 齿数。d 小径。 D 大径。B 齿宽。h 花键齿工作高度,c为倒角尺寸,mm。dm 花键的平均直径,dm=(D-d)/2=2mm所以花键的联接强度良好。L2=115mm轴段3同样选取深沟球轴承6208。(同轴段1。)L3=22mm。轴肩高度h0.07d1,d3= 40mm。轴段4根据轴的直径选用深沟球轴承6207,轴承宽度为17mm。采用轴承盖。L4=39mm,轴肩高度h0.07 d1,d4=35mm。轴段5根据实际设计要求,轴段5主要用于轴伸出箱体与齿轮联接。所以,轴肩高度h0.07,30mm轴段6轴肩高度h0.07d1 ,d6=26mm根据实际需要L6=49mm。由于轴段6主要用于与直齿圆柱齿轮的联接,所以轴段6要有平键。根据实际设计要求,查表(GB/T1096-1979),选用bh=87的平键。4.3 齿轮的选择及计算根据轴的直径,设计出齿轮孔的直径为dk=26mm。根据实际设计需要齿轮模数取m=3,齿数Z=23mm。分度圆直径:齿顶高:ha* 齿顶高系数,ha*=1。齿顶圆直径:齿根高:齿根圆直径:c* 顶系系数,c* =0.25齿高:顶系:基圆直径:齿距:齿宽:齿槽宽:基圆齿距:齿轮宽:4.4 导轨的设计4.4.1 导轨的功用在各类机器和仪器上,运动部件在支撑部件上运动,两个部件在支撑部件上运动,两个部件相互接触的部分称为导轨。导轨的功用是为运动部件导向和承受载荷。在导轨副中,运动的一方称为导轨,不运动的一方称为支撑导轨。动导轨相对于支撑导轨一般只有一个自由度的运动。导轨和轴承在功用,工作原理和结构上都有很多相同之处,特别是圆周运动的导轨更是如此。因此,导轨设计与轴承设计有许多共同之处。4.4.2 直线运动导轨的特点直线运动导轨副,动导轨支撑在静导轨上,支撑载荷并作往复直线运动。直线运动导轨的动导轨和支撑导轨一般长短不一,动导轨常比支撑导轨短。若动导轨在支撑导轨上移动的位置和长度经常改变,则支撑导轨外露部分容易掉入异物损坏导轨,需注意防护。此外,支撑导轨在长度方向上磨损不均匀,会影响导向精度。直线运动导轨的长度决定于运动部件的尺寸,行程及对强度,寿命,刚度的要求。直线运动导轨一般有螺旋螺母,齿轮齿条,液压缸和气缸等传动驱动。这些传动件没有导向作用,导轨导向和支撑作用。当精度要求特别高时,为了减小导轨磨损而增设副导轨,专门用于承受载荷。4.4.3 普通滑动导轨的特点本文设计中选用的是普通滑动导轨,处于混合摩擦下工作,导轨面直接接触,虽然在一定条件下具有一定的动压效应,但是不足以把导轨隔开,不能形成纯液体摩擦。它的优点是:结构简单,制造和维护均方便,所需费用在各类导轨中是最低的。由于表面直接接触,所以刚度好,承载能力大,抗震性好。它的缺点是:摩擦系数大,磨损大,所需的驱动功率大。动静摩擦系数差大;摩擦系数与运动速度是非线性关系,在低速运动(60mm/min)时容易产生爬行。由于价格低廉,这种导轨被广泛用于一般精度要求的机械设备。为了改善这种导轨的摩擦特性,常采用贴塑导轨或防爬油。4.4.4 V型导轨的选用V型导轨靠两侧导向,在各种截面中导向精度最高。三角形的夹角越小,导向精度越高,但有效承载面积(投影面积)减小,承载能力越低。一般做成夹角等于90度,对重型设备可增至110度到120度,对精密设备可减小到70度。三角型一般作成对称的,当受到较大的水平力时,应做成不对称的三角形,受水平力大的一边角度小一些,即陡一些,以免产生“上爬”。V型导轨的优点是:导向精度高,精度保持性好,当导轨磨损后,运动部件会自动下沉以补偿间隙。5 经济性分析本文所设计的液压板材坡口机具有结构简单、成本低廉、可靠性高、能耗低及耐污染等特点,而且对工人的操作技巧要求非常低,不但能减少劳动强度还可以增加生产效率。在生产方面,一般的小型厂矿都能够生产出来,不仅在老式机上进行了改观,而且也能够适应高自动化的发展趋势。6 结论本文根据阜新封闭母线有限公司所需产品的要求,设计了一套板材坡口机的制造方案。按照这套方案所生产的产品,基本满足公司的需求,并且具有一定的经济性和实用性。在液压控制系统的选择中,本文选取了带有背压阀的锁紧回路来控制。采用这种回路的主要作用就是防止液压缸中的活塞杆停止运动后,在外力或自重作用下突然下滑造成事故。带有背压阀主要是防止活塞突然前冲,产生激烈振动。本文所设计的板材坡口机的材料都是以经济实用为中心选取的。所以这套设计方案无论是在价格方面,还是在安全方面都是一个很好的选择。 本文所设计的不足之处主要是尺寸方面存在着差异,由于关于板材坡口机的资料很有限,而且都存在一定的范围,而本文所要设计的数据超出了这个范围,导致了所计算的一部分数据源自于估算,从而影响到板材坡口机的总体尺寸设计。具体尺寸数据还需要通过专业书籍进行校正。致谢 本人的毕业设计论文一直是在导师康文龙老师的悉心指导下进行的。康文龙老师治学态度严谨,学识渊博,为人和蔼可亲。并且在整个毕业设计过程中,康文龙老师不断对我得到的结论进行总结,并提出新的问题,使得我的毕业设计课题能够深入地进行下去,也使我接触到了许多理论和实际上的新问题,使我做了许多有益的思考。在此表示诚挚的感谢和由衷的敬意。 此外,我还要感谢许多学长和同学在整个过程中的帮助和配合。参考文献1孟宪源.现代机构手册M.第1版.北京:机械工业出版社,1994.2 隗金文,王慧.液压传动M.沈阳:东北大学出版社,2001.3 徐灏.机械设计手册(1)M.第2版.北京:机械工业出版社,2000.4 徐灏.机械设计手册(2)M .第2版.北京:机械工业出版社,2000.5 王孝培.实用冲压技术手册M.北京:机械工业出版社,2001.6 李壮云,葛宜远,陈尧明.液压元件与系统M.北京:机械工业出版社.7 冷兴聚,王春华,王琦.机械设计基础M.沈阳:东北大学出版社,2002.8 何存兴.液压元件M.北京:机械工业出版社,1981.10 路甬祥.液压气动技术手册M.北京:机械工业出版社,2002.11 徐灏.机械设计手册(3)M .第2版.北京:机械工业出版社,2000.12 机械设计师手册编写组.机械设计师手册M.北京:机械工业出版社,1989.13 官忠范.液压传动系统M.北京:机械工业出版社,1989.14 甘永立.几何量公差与检测M.第五版.上海:上海科学技术出版社,2001.15 Fitch,E. C. Hydraulic Failure-Analysis & Prevention. Stillwater,OK,USA:FES,Inc.1984.14 Nam P Suh. The Principles Of DesignM. New York: Oxford University Press.1990.15 Trimmer W. Harmonic electrostatic motorsJ. New York: Sensors and Acutators. 1989. 16 Thielicke E. Microactuators and their technologiesJ . New York: Mechatronics. 2000.17 Fitch,E. C. Hydraulic Failure-Analysis & Prevention. Stillwater,OK,USA:FES,Inc.1984.18 Li Changyou, Shao Yaojian,Kamide. 1999.19Li Changyou, Shao Yaojian,Kamide. 1996. 20Grain Kernel During Drying.Transactions of the CSAE.12 (1).199121 M. Inoue, M. Kuroumaru, Structure of tip clearance flow in an isolated axial compressor rotor, American Society ofMechanical Engineers, Journal of Turbomachinery 111 (3) (1989) 250256.22 J.A. Storer, N.A. Cumpsty, Tip leakage flow in axial compressors, American Society of Mechanical Engineers,Journal of Turbomachinery 113 (1991) 252259.23 B. Lakshminarayana, M. Zaccaria, B. Marathe, The structure of tip clearance flow in axial flow compressors,American Society of Mechanical Engineers, Journal of Turbomachinery 117 (1995) 336347.附录A设计与非设计情况下轴流式通风机的处理摘要在设计与非设计情况下,轴流式通风机的噪声处理分析是用两个缠绕在叶片上的热传感器试验测量完成的。在不稳定自然因素条件下,精确速度的测量依据是安放在旋转气流区域的两个热传感器,靠相互作用因素和减缓两个波动速度的时间实现的。该结果表明噪声消除的方法包括:离散频率的噪声由周期性速度波动决定,而噪声的波带与叶片上波动速度有关。通过四个谐波叶片上的频率中,旋转气流的最高频率是主要观察的对象。离散频率包括在非设计操作情况下产生的波动速度的频率,同旋转气流区域和反向气流区域相似。当叶片高速旋转时,最高频率一定是一个重要噪声源。旋转气流的波动速度采用螺旋式,目的是在旋转波动时用来描述产生最高频率的机械。总之,噪声的增加由在低速情况下气流的处理决定,分析认为与速度波动的分配有关,而波动速度又由涡流的泄漏和叶片表面相邻的压力决定。1 引言现阶段的研究主要关注于产生噪声的机械装置。噪声的产生由轴流式通风机的旋转刷旋转的不稳定因素引起的。涡流的泄漏主要在旋转刷区域,这是很多研究者所关注的,因为它在流体领域中很重要。例如:Zoue和Kuroumaru、Store和Cumpsty、Lakshminarayana等都从事该方面的研究。他们指出气流的泄漏是三维的、不稳定的自然因素并且影响产品的寿命和噪声的产生。然而,大多数研究主要集中在叶片上与气体动力学有关的旋转气流,没有考虑到因旋转气流的不稳定因素所产生的噪声。噪声处理水平的提高靠的是Longhouse 、Fukano.etat、Kamier、和Neise在该方面的研究。他们的研究指出频率在中的峰值发生在声谱中,尽管噪声是自然传播的。Kamier和Neise也提出噪声处理与轴流式机械中的不稳定旋转气流有关。然而,以上研究没有详细分析叶片上的气流。对气流结构的理解和叶面上的波动速度频谱一样对分析产生噪声的机械来说很重要。这与气流的泄漏所产生的不稳定因素有密切的关系。另一方面,在轴流式机械的叶片上对在固定框架内高频有价值信号的测量几乎是不可能的。因此,对于与旋转有关的框架内精确速度的测量是十分重要的,很容易理解在旋转机械叶面上波动旋转气流的频率特性。现阶段的研究,对于轴流式通风机速度及速度波动的测量是用一个放在旋转框架内的旋转刷附近的一个热传感器来实现的。Fukano.etat是在旋转框架内气流测量研究的先驱者。他们测量了旋转盘面边缘气流周期性速度波动情况,是通过与最初与设计测量体系相连的传感器来实现的。该结果表明有着重要意义的周期性速度波动是由产生噪声的Kamier涡流通道所决定的。在现阶段的研究中,旋转刷附近速度波动的频谱是通过连接在轴流式通风机中的热传感器来实现的,这与相对速度和波动速度的分配有关。精确速度不稳定频谱的测量是通过在旋转气流区域的两个热传感器实现的,应用相关系数和两个波动速度的延迟进行调查。总之,峰值处理对旋转气流区域、气流动力学噪声的产生有影响,这也是回顾轴流式通风机的两种不同峰值处理方法。2试验仪器及过程2.1测试轴流式通风机现阶段的研究主要集中在低速轴流式通风机上,一种是2mm、一种是4.5mm。对于叶片是2mmTC设计的具体说明总结。叶片的设计气流参数O=0.39(mean axial velocity divied by rotor tip speed)和设计静压力上升参数Os=0.26(static pressure rise divied by dymanic pressure at rotor tip )。静压力上升参数Os与声压水平SPL的划分。旋转体叶面NACA65系列轮廓设计由涡流决定。叶面stagger angle和the angle of attack分别是64.2和4.4。该测试实验采用非设计操作情况下O=0.33、0.31、0.29(25 per cent than the design flow rate)同设计情况下O=0.39一致,而叶片的旋转速度保持在1000r.p.m。叶片旋转体的顶部截面强度为0.55、长度为129mm。依据旋转刷的速度且旋转刷的长度为2.6*10。当前的研究中,对于轴流式通风机的设计是分析三维旋转气流结构,通过数据相似性及实验测结果来实现的。三维峰值泄漏涡流结构及泄漏状况,是一种侧面透视图。涡流鉴别方法与标准化螺旋性Hn的定义详细的在上一层出现。研究发现峰值泄漏涡流的形成与叶片边缘在吸入冲程过程有密切的关系。循环区域的形成导致涡流从叶面内侧溢出。2.2测试过程实验仪器的各个尺寸,是一个内径为0.579m的开环设备。该设备由一个进口、一个由带传动的叶片、一个助推叶片组成。按照空气动力学设计的减震器常用作调节气流速率。进口与测试叶片间的距离是0.43m。测试系统原理图。安放在叶片上的两个热传感器用于介绍现阶段在反面及横跨位置间的相互关系,同时用在旋转叶片内外的三维速度及速度波动情况的介绍。I热传感器应用的是直径为5mm的钨丝,复合探测器直接安装在轮毂上。横跨的探测器用三维跨度系统控制:切向、轴向、径向且安装在轮毂内部0.3mm。在径向、轴向、切向维跨度系统的最大范围分别是45mm、50mm、50(45for one blade passage)。因此,当旋转体正在运动且没有重新安排情况下可能测量到一个叶片。精确波动速度的测量是通过热力风计和与在线电脑相连接的测试仪器来实现的,在线系统是Scientific Corporation通过安装在轮毂内部的水银管是新实现的,来自热探测器的输出是从旋转框架到一个固定框架传送,来自热敏风速计的信号是装置过滤掉超过8.9KHZ的信号。旋转体叶片内外三维速度及速度波动是用横跨式探测器来测量的,而其确定是通过热敏风速计和在线电脑均值仪器实现的。速度及速度波动整体平均值的测量是通过每个测量位置6000个样品数据实现的。波动速度频谱的分析是Onsokki FFT 完成的。在测试系统中,探测器的校准是通过拆换不同旋转测试叶片及测量到的四个不同旋转频率下的切向速度实现的:300、600、900、1200r.p.m。探测器的变形量是由在实验前旋转体的校准仪器的。当内部设备保持连续运行时,TC为2、4mm旋转叶片实验的实现是由旋转刷的直径改变实现的。另一方面,在距旋转叶片上游1m位置处且在旋转轴上,来自旋转叶片上产生的噪声被测量出来。在噪声频谱的测量中,背景噪声一直保持在5dB且在所有频率的声音水平以下。噪声是从测试系统获得的,仅叶片旋转部件被排除在外。结果讨论3.1噪声的增加油泄漏气流和相邻旋转叶片决定声压水平SPL在气流速率O=0.33时急剧上升,之后气流速率则下降。也就是说压力上升Os不是在O=0.29情况下。这就是为什么在低气流速率下、在O=0.29和O=0.35之间SPL上升的原因,这也是以下所讨论的。是在2mTc设计的测试叶片上(O=0.39)和两种非设计操作情况下(O=.33和O=0.29),叶片上99%的范围内测量盘上相对速度的分配情况,这是设备内部的特点。相对速度被计为Vat、瞬时速度则计为Vt:Vat=Vat+Vt/V(1)Vat和Vt分别表示轴向速度和切向速度。叶面上的低速区域导致了泄露气流,管壁上形成的峰值泄露气流在管壁的下表面增加,在设计操作情况下没有形成相邻的压力表面界线。然而,当气流速率下降时与O=0.39比较泄露气流边缘向下移动。因此导致了相邻压力表面的分离。在99%范围内测量盘上波动速度的分配情况,这一情况波动速度用Vf表示,由相对速度Vat所决定。在相互作用的低速区域,每个测量盘上都获得了高速率波动。在相同气流情况下旋转叶片下部分速度波动的分配情况。在近似于气流方向垂直且距叶片边缘2.7mm的测量盘上。水平轴代表到叶片边缘气流方向的垂直距离为。在设计操作情况下旋转刷压力表面附近没有获得高波动速度,因为峰值泄露气流在流动。在相邻压力表面没有形成干扰。然而当气流速率下降时,高速度波动区域的移动与压力面有关。峰值泄露气流受压力表面干扰。特别是最高波动速度出现在最低气流情况下且在压力表面附近。在压力表面附近的高速率波动导致了在叶片表面上的高压力波动,这对叶片上噪声的产生有很大影响。是由在固体表面压力波动的奇偶特性所决定。三种非设计操作情况下在叶片上2mmTC噪声的频谱:O=0.29、0.31、0.33。通过的频率是133Hz,垂直线指的是通过叶片上的有用频率。当前测量的样品频率是5012Hz,仅在1200Hz以下的频率才出现。因为超过1200Hz的声压频率几乎拥有同样的价值。频率最高可达到8400Hz的几乎有相同的声压水平且由叶片驱动马达所产生,在气流速率O=0.33以下的噪声增加有设计操作情况下相同的声压水平。较强的波动速度产生的主要原因即作用在压管内表面和相邻的叶片上。除了有用BFF频率可获得O=0.29、0.31、0.33外,频率最高可达到170、250、330Hz。该频率特性是由于安装在叶片旋转体上的管路决定的。在距叶片旋转体下游9m处产生白噪声,该噪声是由在旋转轴和叶片旋转体上游1m处测量得到的。在图10中可获得以下频宽,频率最高可达到180、360、970Hz。考虑到高频可达到170、330Hz且受180、360Hz管路所产生的频率的影响可以认为在低气流速率情况下噪声的增加是由于旋转的气流在管路表面和相邻压力表面的高速率波动所引起的。在这片论文的下一部份我们将讨论产生离散频率的机械装置。3.2 三维旋转气流的结构为了研究在旋转刷附近的三维旋转气流结构,在叶片下游的相对速度是通过在非设计和设计操作情况下缠绕在旋转体叶片上的热传感器来实现的。两种操作情况的目的是为了理解TC对旋转气流的影响。旋转气流的结构是用两种不同的TC处理方法分析的。安装在轮毂内部的热传感器是通过横跨系统来传输得。在长度方向测量位置的间隔大约是5mm而长度方向和径向的距离大约是3mm。径向测量区域时从255mm(76percent span)到280mm(98percent span)。一个实验表格及叶片2mmTC下的被测低速区域。相对速度Vat被旋转刷速度Vt标准化,低速区域: Vat/Vt0.75。气流的泄露位置,这就导致了数据的相似性且与低速率区域相一致,也就是说在叶片上的低速区域是由峰值泄露涡流引起的。为了比较在设计与非设计情况下峰值泄露我流的结构被测低相对速度区域将在叶片上重现。2mm、4.5mmTCs的测量区域内被测的低相对速度,这是来自构件内的透视图的观点。在设计与非设计操作情况下图中白色和黑色区域所描述获得的低相对速度的情况。在图示中速度区域的范围拥有不同的价值。低速率区域与在叶片上所获得的峰值泄露涡流所决定。可以比较在设计与非设计情况下所获得的峰值泄露涡流。大体上可以了解在轴向压缩机旋转体内Znoue et at所描述的情况,也可以理解当气流速率速率下降时低速度区域将向外传播,也就是在低气流速率情况下的峰值泄露涡流有较大的运动情况的原因。当TC上升时,大的旋转气流的产生是由较大的泄露气流所引起的。在设计操作情况下,旋转气流与数字相似性所获得的结果的比较在本篇论文中所表现出来。3.3在设计操作情况下波动速度频谱的峰值为了研究在叶片上气流的波动情况,设计操作情况下的峰自己泄露涡流成准90度的源盘上的速度波动的分配,这与相对速度的分配有关。在叶片上的峰值泄露涡流成准90度的圆盘位置是一个来自箱体的透视图观点。分别位于涡流的上下游且爱圆盘的A、G位置处。从相对速度的分配上看,旋转气流的获得是由峰值泄露涡流所决定的。在低速区域(bellow the velociety of 0.75)旋转气流的中位是在存在最小动能的地方。相反气流区域是灰色区域且在箱壁上所获得。另一方面,在峰值泄露涡流与主要气流之间的相互作用区域内所获得的高速率波动同在涡流中心区域内所获得的高速率波动同在涡流中心一样。在设计情况下,对于2mmTC的波动速度的频谱的分配情况。FFT分析所获得的频谱,这是在测量位置平均值的64倍。在当前的研究中,对于一种测量情况用表49来测量该频谱。在它们之间,频率在所示12位置处。存在三个径向位置:0.98(RI)、0.96(RII)、0.9(RIII)的范围内。在相反气流区域它们中存在四个位置(RI-E、RI-F、RII-E、RII-F in13(b)。可见,虽然波动速度的频谱的最大值不是转气流的上下游值但是在相反气流区域可见接近400、500Hz的频率峰值。Kamerier和Neise也指出轴流式机械的TC噪声是由于在旋转刷附近的反向气流与旋转气流的不稳定性联系所产生的。3.4 在非设计操作情况下波动速度的频率最大值很多研究者重复研究在叶片存在的不期望看到的现象,噪声的增加是由于旋转的不稳定性和在低气流情况吓轴流式通风机的操作所引起的。在现阶段的研究中,非设计情况下:O=0.31存在2mm和4.5mmTCs操作的轴流式风机里,叶面上旋转气流的结构和波动速度的频谱特性已完成调查。在非设计情况下存在2mmTC操作的轴流式通风机的峰值泄露涡流在三个成准90度的圆盘上相对速度和波动速度的轮廓如。在叶片上测量盘的是箱体的透视图。低相对速度区域自箱体向外传播85%的范围,根据气流速率下降。较大速度区域是由作为旋转气流的阻碍的增加和在叶片上能量的损失引起的。在三个测量盘上相对速度的分配,可以清晰地获得旋转气流的图形。在峰值泄露涡流和主要气流之间的相互作用区域内可获得高波动速率。也就是说当旋转气流朝着切向所移动时,低速度区域将扩大。当气流速率下降时,反向气流区域也将增加,因为旋转气流的扩大是由于它的及时运动引起的。测量盘II和III上所选择的位置速度波动的频谱。在每个测量盘上三个径向位置0.98(RI)、0.96(RII)、0.9(RIII)范围内,在出现频率的12个位置上计X,就(f)所选择的特征。在设计操作情况下反向气流区域可以获得250Hz附近的频率最大值。可见,高速度波动强度增加大约40%,这与设计情况下相比较。更不必说在本部分的描述中速度波动的强度是噪声产生的重要原因。在非设计操作情况下是4.5mmTC的相对速度和波动速度的轮廓图。叶片测量盘的位置用同样的方式。上可以看到来自箱提内的旋转气流扩大了0.75。也就是说和2mmTC的较大气流相比在径向的旋转气流的增加大于12%。在峰值泄露涡流和主要气流之间的相互作用区域获得了在测量盘II和III的高波动速度。当TC增大时,速度波动的强度也增大。测量盘II和III上所选择的位置是速度波动频率的分配情况。包括反向气流区域在内的所有测量位置上可获得的160Hz附近的频谱峰值。在存在4.5mmTC叶片,频率密度S(f)的强度与2mmTC比较两次。也就是说,160Hz附近的较高频率峰值对噪声水平的增加有较大影响。与在设计情况下相比在非设计操作情况下的离散频率价值较低,这是由于旋转气流的大量增加所至。3.5 在非设计情况下泄露气流与延缓时间相互作用的分析在本节的描述中,由波动速度决定的高速率波动以及频率所达到的最大值是在旋转气流区域内获得的。在轴流式风机中,根据TC和在旋转气流中的气流速率,频率的峰值存在不同的价值。为了理解产生频率的机械,在旋转气流中一个参考位置与所选择的参考位置之间有效的分析精确速度的相互作用关系。也就是在旋转气流区域内通过两个热传感器所测量到的精确速度频谱的不稳定因素,该不稳定因素是用相互作用系数以及两个波动速度的延迟时间所界定的。相互作用系数(c-c)和通过两个热传感器所测得的两个精确速度的例子:一个参考位置计作,在中的测量盘II所示,另一个计作,两个所选择的位置都位于旋转气流内部。中的两个波动速度是通过在240和260Hz之间的频率过滤所获得的,是通过两个热传感器测得的精确速度。所选择的过滤器的范围是10Hz250Hz。在现阶段的测量中,有价值信号的采样频率是5120Hz,这是频率为250Hz的20倍。两个波动速度的测量时间是60s(about 80 fan revolutions)。也就是说250Hz速度不是稳定的,因为考虑到振幅的波动。两个波动速度的相关系数延迟时间由相关系数的第一次峰值延迟所决定。两个波动速度的周期的延迟时间在相关系数的第一次峰值和第二次峰值之间。分别说明在2mmTC(O=0.3)时表面II和III上的五个位置相关性的分配情况。在旋转气流区域所分配的五个位置。几乎每个位置相关系数都超过了30.7。在表面II、III上,参考位置的精确速度的测量就是一个例子,它们均有相似的频谱。通过测量盘II、III上的相关系数价值可以看到在旋转气流内的波动速度与上游有着密切的关系。这也暗示旋转气流是由于峰值泄露气流引起的。另一方面,由于管线所引起的延迟时间的存在可以清晰的获得逆时针旋转的气流。在测量盘上波动速度的周期是0.004s(250Hz)。也就是说250Hz的频率是产生旋转气流周期的原因。对于4.5mmTC(O=0.31)在测量盘II和III上,五个位置相互作用关系的分配情况,具有相同的方式。五个位置在旋转气流区域。超过0.7的有价值的相关系数几乎在相同位置出现。由于管路所引起延迟时间的分配,逆时针旋转气流也被获取。他的周期大约是0.006s。旋转气流的周期与频谱峰值周期一致。3.6 噪声是由不稳定的旋转气流引起的本节所描述的是在旋转气流下的峰值频率与低速率的密切关系,而低速率是由峰值泄露涡流所引起的。众所周知,在轴流式风机中峰值泄露涡流是三维的、不稳定的自然因素。,波动速度在240和260Hz之间的频率经过滤获得了旋转气流的不稳定特性,振幅的重复又改变了波动速度。为了描述在旋转气流中峰值频率的产生机械,作者推荐了一个速度波动源的螺旋式概念。也就是低速率沿着螺旋结构、朝着顺时针方向运动。250Hz的风致频率是在旋转体的相关框架内的复合味指出测量到的并且在该处所产生的。因为对于一个旋转体来说沿着螺旋结构以0.004s的低速度向下游运动。当然,由于峰值泄露涡流所引起的低速度是在低速区域所产生的。以旋转速度是1000r.p.m的250Hz峰值频率与该噪声有着密切的关系。根据2mmTC(O=0.31)叶片旋转速度的速度波动的频谱。峰值频率成比例的增加是由于叶片旋转体旋转速度的增加。峰值频率于叶片旋转体在气流速率下与旋转速度的关系。峰值频率随着叶片旋转体在连续旋转速度下气流速率的增加而增加。这也暗示叶片以高速率旋转时,噪声是由峰值频率引起的,是噪声的重要来源。最后,在设计(O=0.39)和非设计(O=0.31)情况下,轴流式风机内有两种不同的TCS噪声频谱,通过管路旋转线可以看出叶片上频率的意义。在设计操作情况下两种400、500Hz峰值频率。当O=0.31时,如图16的250、160Hz峰值频率。在同样的情况下,当TC增大时,两种噪声的离散频率是由频率峰值和噪声的增加引起的,它们是由较大的旋转气流引起的,而较大的旋转气流又由增加的气流所引起的。可见,噪声是由在轴流式风机中的TC引起的且影响低频宽度。4 结论噪声有轴流式风机里的两种不同的TC决定,在设计与非设计情况下通过两个缠绕的热传感器分析获得。结果总结如下:1 噪声的增加由在低速率情况下的TC决定,是由峰值泄漏涡流和乡邻压力表面、箱体表面间的旋转气流的高速率波动引起的。速度波动强度的增加是由于TC的增加和气流速率的下降引起的。2 在四个有用频率下,旋转气流中可获得峰值频率。而在设计操作情况下反向气流区域获得的频率同时在旋转气流区域,非设计操作情况将产生速度波动的峰值频率。3 速度波动的峰值频率成倍的增加是由于叶片的旋转速度的增加引起的。在连续旋转速度下,随着气流速率的增加频率也增加。这就暗示当叶片高速旋转时,噪声是由于峰值频率引起的、是在省的重要来源。致谢 作者感谢Mr.N.ogata和Mr.D.Sato在本次实验所给予的帮助。附录BTip clearance noise of axial flow fans operating at design and off-design conditionT. Fukano*, C.-M. JangAbstractThe noise due to tip clearance (TC) flow in axial flow fans operating at a design and off-design conditions is analyzed by an experimental measurement usingtwo hot-wire probes rotating with the fan blades. The unsteady nature of the spectra of the real-time velocities measured by two hot-wire sensors in a vortical flow region is investigated by using cross-correlation coefficient and retarded time of the two fluctuating velocities. The results show that the noise due to TC flow consists of a discrete frequency noise due to periodic velocity fluctuation and a broadband noise due to velocity fluctuation in the blade passage. The peak frequencies in a vortical flow are mainly observed below at four harmonic blade passingfrequency .The discrete frequency component of velocity fluctuation at the off-design operating conditions is generated in vortical flow region as well as in reverse flow region. The peak frequency can be an important noise source when the fans are rotated with a high rotational speed. The authors propose a spiral pattern of velocity fluctuation in the vortical flow to describe the generation mechanism of the peak frequency in the vortical flow. In addition, noise increase due to TC flow at low flow rate condition is analyzed with relation to the distribution of velocity fluctuation due to the interference between the tip leakage vortex and the adjacent pressure surface of the blade.1. IntroductionThe present study is focused on the mechanism of sound generation due to unsteady behavior of vortical flow near the rotor tip in axial flow fans. The nature of a tip leakage vortex observed in a rotor tip region has been studied by many researchers because of its important role on the flow field; for example, Inoue and Kuroumaru 1, Storer andCumpsty 2, and Lakshminarayana et al. 3. They showed that the tip leakage flow has a three-dimensional and an unsteady nature, and effect on a loss production and a noise generation. However, most studies are mainly focused on thevortical flow in a blade passage with relation to aerodynamic performance without considering the sound generation due to the unsteady behavior of the vortical flow.Noise level increase by enlarging a tip clearance (TC) is studied by Longhouse 4, Fukano et al. 5, and Kameier and Neise 6. Their studies showed that the spectral peaks occurred in sound spectra although a TC noise is broadband naturally. Kameier and Neise 6 also reported that the TC noise associated with a rotatingflow instability in axial turbomachines was generated under reverse flow conditions in a TC gap. However, the above studies were performed without detailed flow analysis in the blade passage. The understanding of the detailed flow structure as well as the spectrum of a fluctuating velocity in the blade passage is important to analyze the generation mechanism of the TC noise, which is closely related to the unsteady behavior of the tip leakage vortex.On the other hand, the measurement of the real-valued signal with a high sampling frequency in the stationary frame is nearly impossible in the blade passage of axial turbomachines. Therefore, it is essential to measure a real-time velocity in the relative frame of reference rotatingwith a rotor to readily understand the frequency characteristics of a fluctuatingvortical flow in the rotor blade. Detailed measurements of a velocity and a velocity fluctuation in the axial flow fans are made usinga rotatinghot-wire sensor near the rotor tip in the rotatingframe in the present study.The pioneer study of the flow measurement in the rotational frame was performed by Fukanoetal. 7. They measured the periodic velocity fluctuation in the downstream of the trailingedg e of a rotating flat-plate blade using a hot-wire sensor attached to the originally designed measuring system. The result showed the important role of the periodic velocity fluctuation due to Karman vortex street in the generation of broadband noise.In the present study, spectra of the velocity fluctuation near rotor tip were measured using the rotatinghot-wire sensor to elucidate the TC noise in the axial flow fans with relation to the distribution of the relative velocity and the velocity fluctuation. The unsteady nature of the spectra of the real-time velocities measured by two hot-wire sensors in the vortical flow region is also investigated by using cross-correlation coefficient and retarded time of the two fluctuating velocities. The present study was performed at off-design operating conditions as well as a design flow condition. In addition, the TC effects on the vortical flow field and the aerodynamic noise generation are also reviewed by introducing two different TCs to the axial flow fans.2. Experimental apparatus and proceduresTest axial flow fanThe present study was performed on low speed axial flow fans in two cases of the TC of 2mm (1.6 per cent tip chord) and 4.5mm (3.5 per cent tip chord). Its design specifications for the fan having2 mm TC are summarized in Table 1. The fan has a design flow coefficient F (mean axial velocity divided by rotor tip speed) of 0.39 and a design static pressure rise coefficient CS (static pressure rise divided by dynamic pressure at rotor tip) of 0.26. Fig. 1 shows the pressure rise CS and the sound pressure level SPL plotted against flow rate of the test fan. The rotor blade has NACA 65 series profile sections designed by free vortex operation. The blade stagger angle and the angle of attack at the rotor tip are 64.2_ and 4.4_, respectively. The experimental measurements were carried out at the off-design operating conditions of F=0.33, 0.31 and 0.29 (25 per cent lower than the design flow rate) as well as at the design condition of F=0.39 while rotational speed of the fan rotor was kept constant, 1000 r.p.m. The blade tip section of the rotor has the solidity of 0.55 and the chord length of 129 mm. Reynolds number based on the rotor tip speed and the rotor tip chord length is 2.6_105.Table 1Design specifications of axial flow fanFlow coefficient 0.39Pressure coefficient 0.26Rotational speed 1000 r.p.m.Tip radius 287.5mmHub-tip ratio 0.52Blade profile NACA65Number of blade 8The three-dimensional vortical flow structure in the axial flow fans operatingat the design condition was analyzed by numerical simulation and experimental measurement in the previous study 8. Three-dimensional tip leakage vortex structure and leakage streamlines surrounding the tip leakage vortex obtained by the numerical simulation for the axial flow fan having 2mm TC are shown in Fig. 2, which is a perspective view from the casingside. The vortex core identification method and the definition of normalized helicity Hn were presented in detail in the previous paper 8. It was found that the tip leakage vortex formed close to the leading edge of the blade tip on suction side grew in the streamwise direction, and formed a local recirculation region resulting from a vortex breakdown inside the blade passage as shown in Fig. 2.2.2. Measuring proceduresFig. 3 shows the experimental set-up alongwith its major dimensions. It was an open-loop facility havingthe duct inner diameter of 0.579 m. The facility consisted of a bellmouth inlet, a fan drivingmotor connected by the belt, a damper and a booster fan. The aerodynamically designed damper was used to adjust the flow rates. The distance between the bellmouth inlet and the test fan was 0.43 m.A schematic view of the measuringsystem is shown in Fig. 4. Two hot-wire sensors rotating with the fan rotor were introduced for the present study to obtain the cross-correlation between a reference position and target (traversing) positions, as well as the three-dimensional velocity and velocity fluctuation inside and downstream of the rotor blade. The I-type sensor of the hot-wire probe was a tungsten filament wire of 5-mm diameter. The wires of the both probe sensors were set parallel to the radial direction of the rotor blade. The supporter of the fixed probe as shown in Fig. 4 was directly installed on the hub. The traversingprobe was controlled by the threedimensional traversingsystem, i.e., radial, axial and rotational directions, installed inside of the hub with traverse resolution of 0.3 mm. The maximum traversingspan of the traversing system in radial, axial and tangential directions was 45 mm, 50mm and 50_ (45_ for one blade passage),respectively. Therefore, it could measure one blade passage of the tip region without rearranging the traversingsystem while the rotor was in motion. The real-valued velocity fluctuations were measured by usingconstant-temper ature hot-wire anemometer and interfacingtechnique with an on-line computer. The diagram of the on-line system is shown in Fig. 5. The output from the hotwire probe was carried from a rotating frame to a stationary frame through Michigan Scientific Corporation mercury slip-ringunit installed inside of the hub as shown in Fig. 3. The signal obtained from the hot-wire anemometer was filtered out the frequency above 8.9 kHz usingthe low pass filter as shown in Fig. 5.Three-dimensional velocity and velocity fluctuation inside and downstream of the rotor blade were measured by the traversingprobe, and determined by usinga constant-temperature hot-wire anemometer and averaging technique with an on-line computer. Ensemble averaged values of the velocity and the velocity fluctuation were obtained by 6000 samplingdata at each measuring position. The spectrum analysis of the velocity fluctuation was performed usingOnosokki FFT analyzer. The calibration of the probe at the measuringsystem was performed by detachingthe rotor blade from the test fan and measuringthe tangential velocity for the four different rotational frequencies: 300, 600, 900 and 1200 r.p.m. In addition, the magnitude of the deformation of the probe supporter caused by the rotor rotation was calibrated prior to the experiments. The experiments with rotor blade havingthe TC of 2 and 4.5mm were conducted by changingthe rotor tip diameter while the inner diameter of the casingwas kept constant.On the other hand, the noise generated from the rotor blades was measured at the position of 1m upstream from the fan rotor and on the rotational axis. In the measurement of the noise spectrum, the background noise kept 5 dB below the sound level of all frequencies. It is noted that the noise is obtained from the measuringsystem that only the fan rotor is excluded.3. Results and discussionNoise increase due to the interaction of a leakage flow and an adjacent rotor bladeAs shown in Fig. 1, the sound pressure level SPL is sharply increased from the flow rate of F 0:33 as a flow rate is decreased. It is noted that the flow condition is not in a stall at F 0:29 from the pressure rise CS shown in Fig. 1. The reason why the SPL is increase at the low flow rate between F 0:33 and F 0:29 will be discussed in the following.Fig. 6 shows the distribution of the relative velocity on the plane of 99 per cent span of the blade in the test fan having2 mm TC for the design (F 0:39) and the two off-design operating conditions (F=0.33 and 0.29), which is a perspective view from the casing. The relative velocity Vat is defined and normalized by the circumferential velocity of the blade tip, Ut:Where Va and Vt denote axial velocity and tangential (circumferential) velocity, respectively. In Fig. 6, the low velocity region in the blade passage results from the tip leakage vortex as shown in Fig. 2 8. The tip leakage vortex formed on suction side grows in the downstream direction without interference with the adjacent pressure surface in the design operating condition. However, the tip downstream side of the leakage vortex is moved upstream compared to the case of the F 0:39 as the flow rate is decreased, thus resultingin interference with the adjacent pressure surface as shown in Fig. 6.Fig. 7 shows the distribution of the velocity fluctuation on the plane of 99 per cent span, which is presented in the same condition as shown in Fig. 6. The velocity fluctuation Vf is defined by,where V0 at is the fluctuatingcomponent of the relative velocity defined by Eq. (1). The high velocity fluctuation on the each plane is observed near the correspondinglow velocity region shown in Fig. 6. It is well known that the high velocity fluctuation is closely related to the aerodynamic noise generation. It should be noted that the high velocity fluctuation region in the blade passage is enlarged as the flow rate is decreased. The increase of the broadband noise in the low flow rate conditions is mainly caused by the high velocity fluctuation as shown in Fig. 7.Figs. 8(a)(c) shows the distribution of the velocity fluctuation downstream of the rotor blade having2 mm TC for the same flow conditions shown in Figs. 6 and 7. The measuringplane, which is nearly perpendicular to streamwise direction, is located 2.7mm downstream from the blade trailing edge. In the figure, the horizontal axis represents the perpendicular distance Z to the streamwise direction from the blade trailing edge. The high velocity fluctuation near the pressure surface of the rotor tip is not observed in the design operating condition as shown in Fig. 8(a) because the tip leakage vortex is moved downstream without interference with the adjacent pressure surface as described in Fig. 6(a). However, the high velocity fluctuation region movescloser to the pressure side as the flow rate decreases, and the tip leakage vortex interferes with the pressure surface as clearly shown in Figs. 8(b) and (c). Especially, the highest velocity fluctuation presents near the pressure surface (J in Fig. 8(c) in the lowest flow condition (F=0.29). The high velocity fluctuation near the pressure surface induces high pressure fluctuation on the bladesurface, which has strongly effect on the fan noise generation because of the dipole characteristic of the pressure fluctuation on the solid surface 9.Fig. 9 shows the spectra of noise in the fan having2 mm TC for the three off-design operating conditions: F=0.29, 0.31 and 0.33. In the figure, vertical dashed lines indicate the harmonic frequencies of blade passingwhere the fundamental blade passing frequency BPF is 133 Hz. The samplingfrequency of the present measurement is 5012 Hz, and the frequency below 1200 Hz is only presented because the sound pressure level over the 1200 Hz has almost same value irrespective of the flow rate F: The spectral peaks at the 840 Hz, which have almost same sound pressure level, are generated by the fan driving motor shown in Fig. 3. The noise increase below the flow rate F 0:33; which has a same sound pressure level of the design operating condition as shown in Fig. 1, is mainly caused by the stronger velocity fluctuation as described in the Fig. 7 which interacts with the duct inner surface and the adjacent blade. The spectral peaks at 170, 250 and 330 Hz exceptingthe harmonic of BPF are also observed at F=0.29, 0.31 and 0.33. To investigate spectral characteristics due to the duct installed downstream of the fan rotor, a speaker generating a white noise was installed 9m downstream from the fan rotor, and spectrum of the noise was measured at the position of 1m upstream from the fan rotor and on the rotational axis. The spectral peaks of 180, 360 and 970 Hz havinga relatively wide frequency band are observed in Fig. 10. It can be considered that the high peaks at the 170 and the 330 Hz shown in Fig. 9 are influenced by frequencies caused by the duct, 180 and 360 Hz. It should be noted that the noise increase at the low flow rate condition is mainly caused by the high velocity fluctuation in the vortical flow interactingwith the duct surface and the adjacent pressure surface.We will discuss the mechanism of the generation of the discrete frequency component more in the later part of this paper.3.2. Three-dimensional vortical flow structureTo investigate the three-dimensional structure of the vortical flow near the rotor tip, the relative velocity in the blade passage and downstream was measured by the hot-wire sensor (traversing probe in Fig. 4) rotatingwith rotor blade in the off-design operatingcondition (F=0.31) and in the design condition (F=0.39). The structure of the vortical flow was also analyzed for the two different TCs (2 and 4.5mm) at the both operatingconditions to understand the TC effect on the vortical flow.The hot-wire sensor mounted inside of the hub was moved by the traversingsystem as already shown in Fig. 4. The interval of measuringpositions is about 5mm in the pitchwise direction, and 3mm in the streamwise direction and in the spanwise direction. The measuringarea in the radial direction is from 255mm (76 per cent span) to 280mm (98 per cent span). Fig. 11 shows an experimental grid and a measured low velocity region in the blade passage for the fan having 2mm TC. In the figure, the relative velocity Vat is normalized by the rotor tip speed Ut; and only the low relative velocity region with Vat=Uto0:75 is shown. The position of the leakage streamlines shown in Fig. 2, which are the result of the numerical simulation 8, correspond well to that of the low velocity region. It should be noted that the low velocity region in the blade passage is caused by the tip leakage vortex 8.To compare the structure of the tip leakage vortex in the cases of the design and the off-design conditions, the measured low relative velocity region is reproduced in the blade passage. Fig. 12 shows the distributions of the low relative velocity with the measuringreg ion for the 2 and the 4.5mm TCs, which are the perspective view from the casing. The regions colored with white and black in Fig. 12 represent the low velocity area obtained in the off-design and the design operating condition, respectively. In the figure, the scale of the velocity region has a different value. The low velocity region due to the tip leakage vortex is clearly observed in the blade passage. It is found that the tip leakage vortex obtained at the off-design condition is located upstream compared to that at the design condition for the both TCs. This is generally acknowledged as described by Inoue et al. 1 in the axial compressor rotor. It can also be understood that the low velocity region spreads out as the flow rate is decreased, which is caused by the larger movement of the tip leakage vortex in this low flow rate condition. A large vortical flow is generated due to the larger leakage flow as the TC is increased. The detailed vortical flow and its comparison to the result obtained by numerical simulation in the design operating condition was performed in the previous paper 8.3.3.Spectral peaks of fluctuating velocity at a design operating conditionTo investigate the behavior of the flow fluctuation in the blade passage, distributions of the velocity fluctuation on a quasi-orthogonal plane to the tip leakage vortex at the design operating condition are shown in Fig. 13 with relation to the distribution of the relative velocity. The position of the quasi-orthogonal plane to the tip leakage vortex in the blade passage, which is a perspective view from casing, is shown in Fig. 13(c). In the figure, positions of A and G in the plane are located upstream and downstream of the vortex, respectively. From the distribution of the relative velocity as shown in Fig. 13(a), it can be clearly observed the vortical flow due to the tip leakage vortex. The vortical flow is formed at a low velocity region (below the velocity of 0.75) and a main flow is surrounded the vortical flow. The center of vortical flow is the position having a minimum kinetic energy. A reverse flow region presented by gray color in Fig. 13(a) is also observed near the casingwall. On the other hand, the high velocity fluctuation is observed in the interference region between the tip leakage vortex and the main flow as well as in the vortex core as shown in Fig. 13(b).Fig. 14 shows the spectral distributions of the velocity fluctuation at the positions selected near the rotor tip on the quasi-orthogonal plane of Fig. 13 for the fan havingthe 2mm TC operatingin the design condition. The spectra are obtained by a FFT analyzer, which averages each value 64 times at a measuringposition. In the present study, the spectra are measured at 49 grid points for one operatingcondition. Amongthem, the spectra at 12 positions shown by _ symbols in Fig. 13(b) are selected at the three radial positions of 0.98(RI), 0.96(RII) and 0.9(RIII) span. Four positions (RI-E, RI-F, RII-E, and RII-F in Fig. 13(b) of them exist in the reverse flow region. Itis found that spectral peaks near the 400 and 500 Hz are found in the reverse flow region, although the peak of the velocity fluctuation spectrum is not clear upstream and downstream of the vortical flow. Kameier and Neise 6 also reported that TC noise of an axial turbomachine is caused by reverse flow in relation to the rotatingflow instability near the rotor tip.3.4. Spectral peaks of fluctuating velocity at an off-design operating conditionIt has been reported by many researchers that undesired phenomena on the fan performance and noise increase due to a rotatinginstability and stall in the axial fans operating in a low flow condition. In the present study, the vortical flow structure and the spectral characteristics of the fluctuating velocity in the blade passage are investigated in the axial flow fans having the 2 and the 4.5mm TCs operatingat the off-design condition of F=0.31.Fig. 15 shows the contour of relative velocity and velocity fluctuation on the three quasiorthogonal planes to the axis of the tip leakage vortex of the axial flow fan having the 2mm TC operatingat the off-design condition. The positions of the measuringplanes (I, II and III) in the blade passage are shown in Fig. 15(b), which is a perspective view from casing. The low relative velocity region spreads out to 85 per cent span from the casing according to decrease of flow rateas shown in Figs. 13(c) and 15(b). The larger velocity region is caused by as a result of the increase of the blockage of the vortical flow and the loss production in the blade passage. From thedistributions of the relative velocity on the three planes as shown in Figs. 15(a), (c) and (e), vortical flow pattern is again clearly observed. High velocity fluctuation is observed in the interference region between the tip leakage vortex and the main flow as shown in Figs. 15(d) and (f). It is also noted that the low velocity region is expanded out as the vortical flow is moved to the streamwise direction. The reverse flow region is also increased as the flow rate is decreased because of the expansion of the vortical flow due to its large movement in time.Fig. 16 shows the spectra of the velocity fluctuation at the positions selected on planes II and III of Fig. 15(b). At each plane, the spectra at 12 positions presented by _ symbols in Figs. 15(d) and (f) are selected at the three radial positions of 0.98(RI), 0.96(RII) and 0.9(RIII) span. Spectral peaks near the 250 Hz are mainly observed in the reverse flow region like in the design operating condition. It should be noted that the intensity of the high velocity fluctuation is increased about 40 per cent compared to that at the design operating condition. Needless to say, the higher intensity of the velocity fluctuation is the important source of the broadband noise increase asdescribed in the previous section.Fig. 17 shows the contour of relative velocity and the velocity fluctuation for the 4.5mm TC at the off-design operating condition. The positions of the measuring planes in the blade passage are shown in Fig. 17(b), which are presented in the same manner as shown in Fig. 15. As shown in Fig. 17, the vortical flow is expanded to 0.75 span from the casing. That is, the vortical flow is increased about 12 per cent in the radial direction compared to that for the 2mm TC due to the larger TC flow. High velocity fluctuation on planes II and III is observed at the interference region between the tip leakage vortex and the main flow. The intensity of the velocity fluctuation is also increased as the TC is enlarged.Fig. 18 shows the spectral distributions of the velocity fluctuation at the positions selected on planes II and III of Fig. 17(b). Spectral peaks near the 160 Hz are observed at all measuringposition includingthe reverse flow region. The intensity of a spectral density Sef T as shown in Fig. 18 of the fan havingthe 4.5mm TC is about twice compared to that for the 2mm TC. This means that the higher spectral peak at 160 Hz is more effective on the increase of a noise level. It is noted that the discrete frequency at the off-design operating condition have a lower value compared to that at the design condition because of the larger expansion of the vortical flow.3.5. Analysis of cross-correlation in the leakage flow and retarded time at an off-design operating conditionAs described in the previous sections, the high velocity fluctuation and the spectral peaks due to the fluctuatingvelocity are observed near the vortical flow region. The frequency havinga spectral peak in the vortical flow has a different value accordingto the TC and the flow rate in the axial flow fans. To understand the generation mechanism of the frequency having a spectral peak, it is effective to analyze the cross-correlation of the real-valued velocities between one reference position and target ones selected in the vortical flow. That is, the unsteady nature of the spectra of the real-time velocities measured by two hot-wire sensors in the vortical flow region is investigated by usingcross-correlation coefficient and retarded time of the two fluctuatingvelocities.Fig. 19 shows one example of the cross-correlation (C-C) coefficient and the retarded time for two real-valued velocities measured by the two hot-wire sensors: one is positioned at the fixed reference point marked by J as shown on plane I of the Figs. 15(a) and (b) and the other is at 4 on plane II of the Fig. 15(c). Both selected positions are located inside the vortical flow. Two fluctuatingvelocities shown in Fig. 19(a) are obtained by filteringthe frequency between 240 and 260 Hz to the real-valued velocities measured by two hot-wire sensors. The band-pass filter selected has the band of 10 Hz to the peak frequency of 250 Hz as shown in Fig. 16. In the present measurement, the samplingfrequency of the real-valued signals is 5120 Hz, which corresponds 20 times the frequency of 250 Hz. A measuringtime of the two fluctuatingvelocities is 0.6 s (about 80 fan revolutions). It is notice that the 250 Hz velocity component is not steady because the amplitude fluctuates considerably.The cross-correlation coefficient of the two fluctuatingvelocities are shown in Fig. 19(b). In the figure, the retarded time is determined by the delayed time of the first peak of the cross-correlation coefficient. The period of the two fluctuatingvelocities is the delayed time between the first peak of the cross-correlation coefficient and the second one as shown in Fig. 19(b).Figs. 20(a) and (b) respectively show the distribution of the cross-correlation at 5 positions on planes II and III for the 2mm TC at F=0.31. The five positions are distributed in the vortical flow region as shown in Figs. 15(c) and (e). The coefficient shows a high value over 0.7 at almost positions. This is the evidence that the real-valued velocities measured at the fixed reference position and the corresponded positions on planes II and III have similar spectra. Throughout the value of the coefficient on planes II and III, it can be concluded that the velocity fluctuation in thevortical flow has a close relation to that of upstream. This also implies that the vortical flow is the tip leakage flow.On the other hand, a counter-clockwise vortical flow is clearly observed through the retarded time presented by a dashed line in Fig. 20. The period of the fluctuatingvelocities is 0.004 s (250 Hz) on the planes II and III, which corresponds the frequency havingspectral peak as shown in Fig. 16. That is, the frequency of 250 Hz is the result of a period for one revolution of the vortical flow.Fig. 21 shows the distribution of the cross-correlation at 5 positions on planes II and III for the 4.5mm TC at F=0.31, which is presented in the same manner as Fig. 20. The five positions are in the vortical flow region as shown in Figs. 17(c) and (e). The coefficient havinga high value over 0.7 is also shown at almost positions. A counter-clockwise vortical flow from the distribution of the retarded time presented by dashed line is also observed, which has the period of about 0.006 s (167 Hz) in Fig. 21. The period for one revolution of the vortical flow has a fairly good agreement to the frequency havingthe spectral peak in Fig. 18.3.6. Tip clearance noise caused by the unsteady vortical flowAs described in the previous sections, the peak frequencies in the vortical flow are closely related to the behavior of the low velocity due to the tip leakage vortex. It is well known that the tip leakage vortex has a three-dimensional and unsteady nature in axial flow fans. As shown in Fig. 19(a), the unsteady characteristic of vortical flow is observed from the fluctuatingvelocity filtered between 240 and 260 Hz, and the fluctuatin
温馨提示:
1: 本站所有资源如无特殊说明,都需要本地电脑安装OFFICE2007和PDF阅读器。图纸软件为CAD,CAXA,PROE,UG,SolidWorks等.压缩文件请下载最新的WinRAR软件解压。
2: 本站的文档不包含任何第三方提供的附件图纸等,如果需要附件,请联系上传者。文件的所有权益归上传用户所有。
3.本站RAR压缩包中若带图纸,网页内容里面会有图纸预览,若没有图纸预览就没有图纸。
4. 未经权益所有人同意不得将文件中的内容挪作商业或盈利用途。
5. 人人文库网仅提供信息存储空间,仅对用户上传内容的表现方式做保护处理,对用户上传分享的文档内容本身不做任何修改或编辑,并不能对任何下载内容负责。
6. 下载文件中如有侵权或不适当内容,请与我们联系,我们立即纠正。
7. 本站不保证下载资源的准确性、安全性和完整性, 同时也不承担用户因使用这些下载资源对自己和他人造成任何形式的伤害或损失。
提示  人人文库网所有资源均是用户自行上传分享,仅供网友学习交流,未经上传用户书面授权,请勿作他用。
关于本文
本文标题:板材坡口机的总体结构设计【7张CAD图纸+毕业论文全套】
链接地址:https://www.renrendoc.com/p-438019.html

官方联系方式

2:不支持迅雷下载,请使用浏览器下载   
3:不支持QQ浏览器下载,请用其他浏览器   
4:下载后的文档和图纸-无水印   
5:文档经过压缩,下载后原文更清晰   
关于我们 - 网站声明 - 网站地图 - 资源地图 - 友情链接 - 网站客服 - 联系我们

网站客服QQ:2881952447     

copyright@ 2020-2025  renrendoc.com 人人文库版权所有   联系电话:400-852-1180

备案号:蜀ICP备2022000484号-2       经营许可证: 川B2-20220663       公网安备川公网安备: 51019002004831号

本站为文档C2C交易模式,即用户上传的文档直接被用户下载,本站只是中间服务平台,本站所有文档下载所得的收益归上传人(含作者)所有。人人文库网仅提供信息存储空间,仅对用户上传内容的表现方式做保护处理,对上载内容本身不做任何修改或编辑。若文档所含内容侵犯了您的版权或隐私,请立即通知人人文库网,我们立即给予删除!