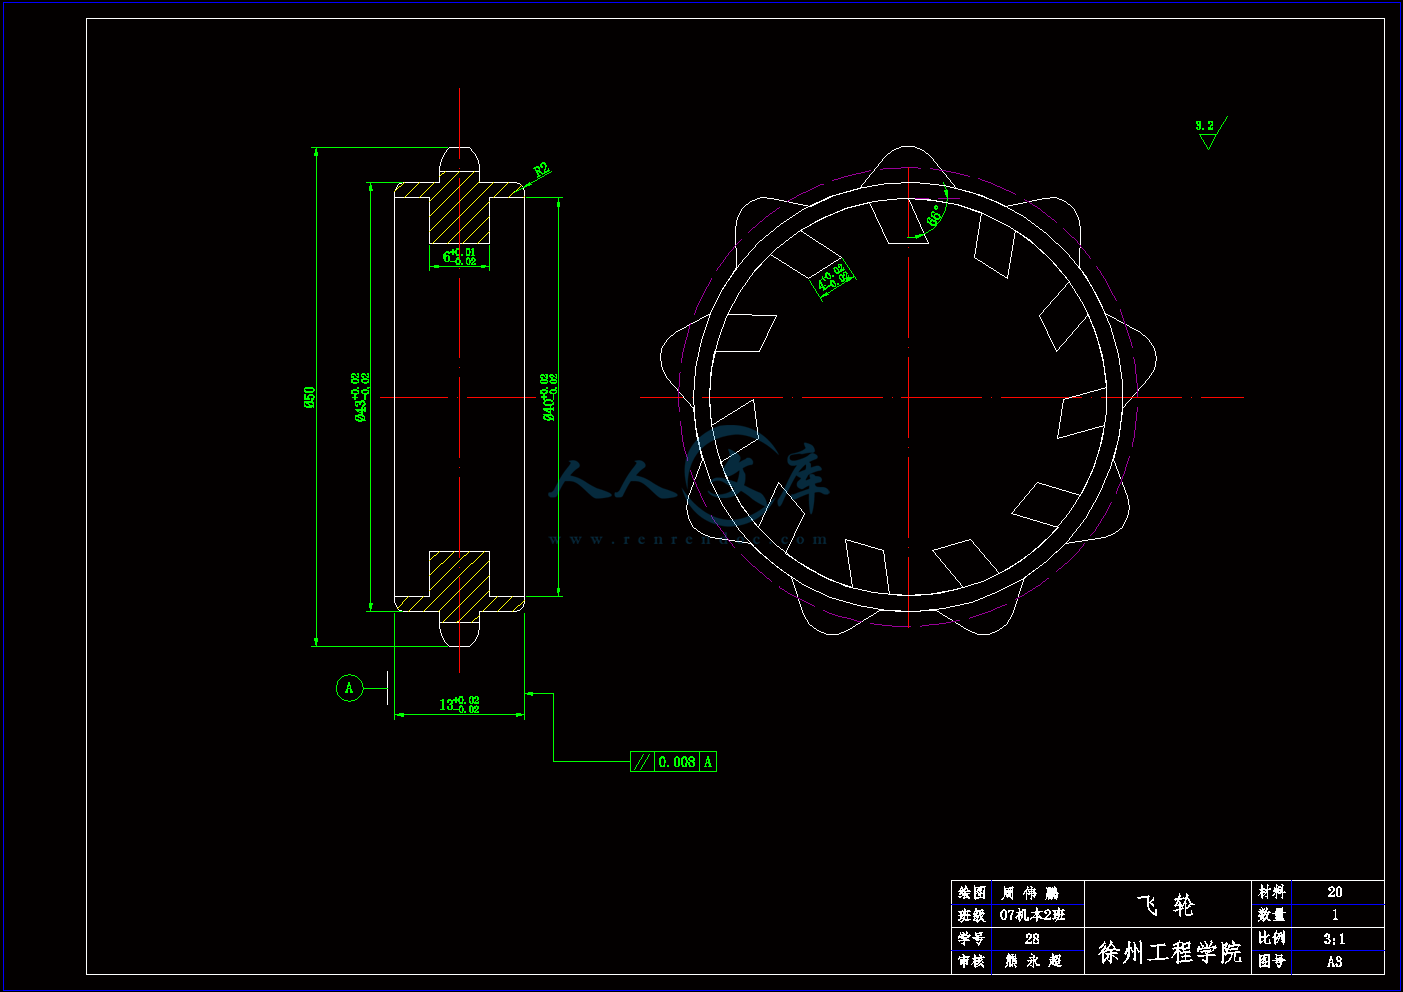
飞轮.dwg
飞轮.dwg

新型电动自行车及动力反馈制动系统设计【机+电】【10张图纸】【优秀】

收藏

资源目录
跳过导航链接。
压缩包内文档预览:
预览图
编号:422413    类型:共享资源    大小:4.17MB    格式:RAR    上传时间:2015-04-03 上传人:上*** IP属地:江苏
39
积分
关 键 词:
新型 电动自行车 动力反馈 制动系统 设计 图纸 新型电动自行车
资源描述:

新型电动自行车及动力反馈制动系统设计

47页 27000字数+说明书+外文翻译+10张CAD图纸【详情如下】

刹车上触压片.dwg

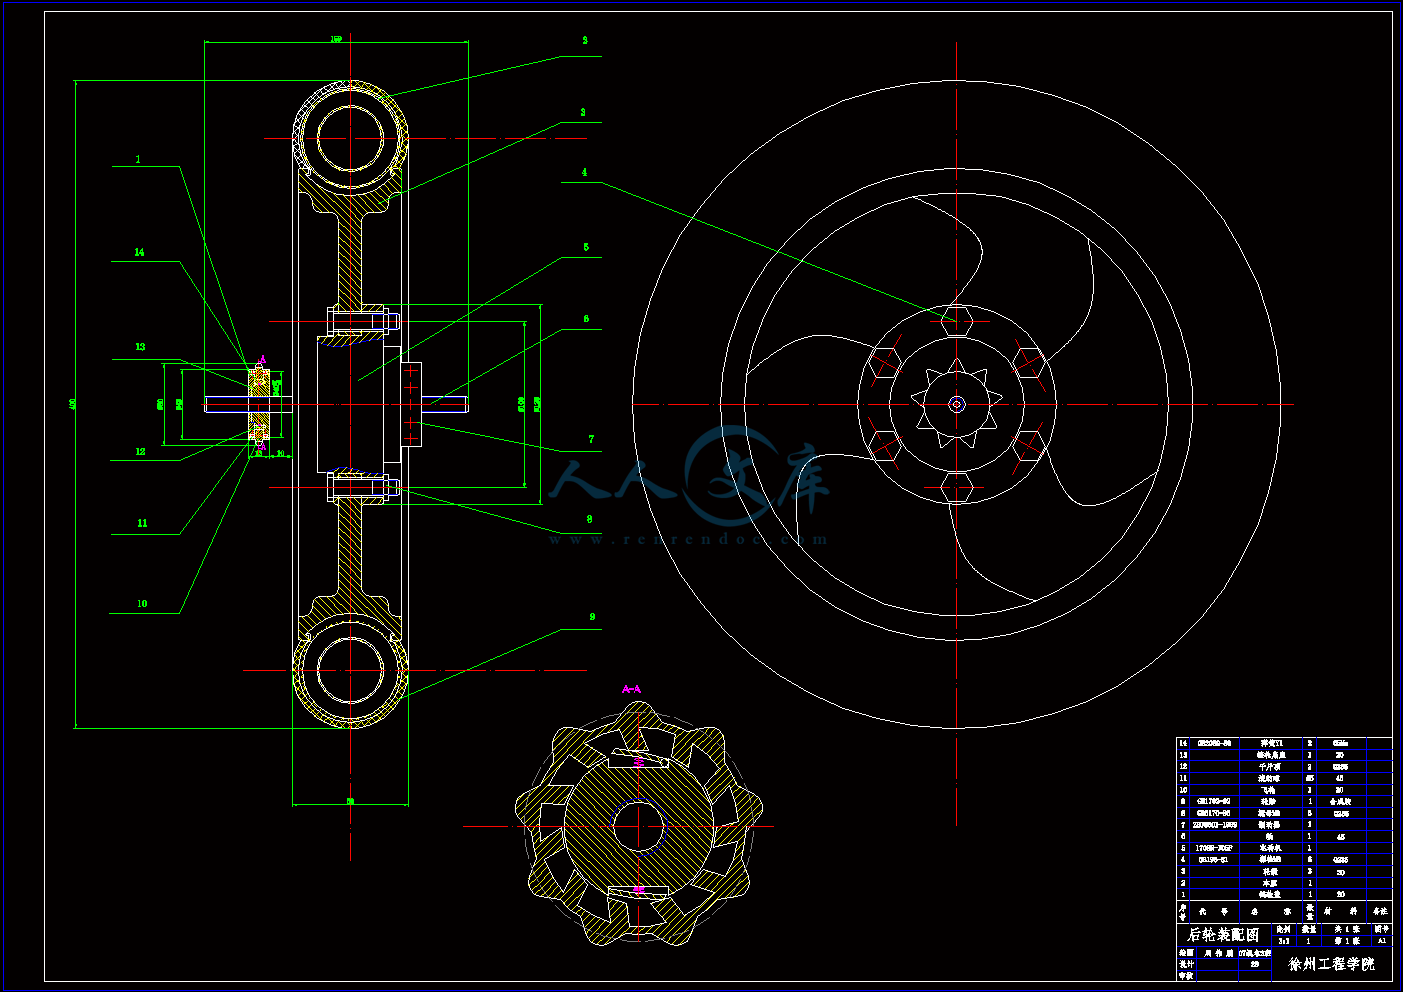
后轮装配图.dwg

外文翻译--阀控式铅酸蓄电池的失效模式在深放电电动自行车的应用  中文版.doc

外文翻译--阀控式铅酸蓄电池的失效模式在深放电电动自行车的应用  英文版.pdf

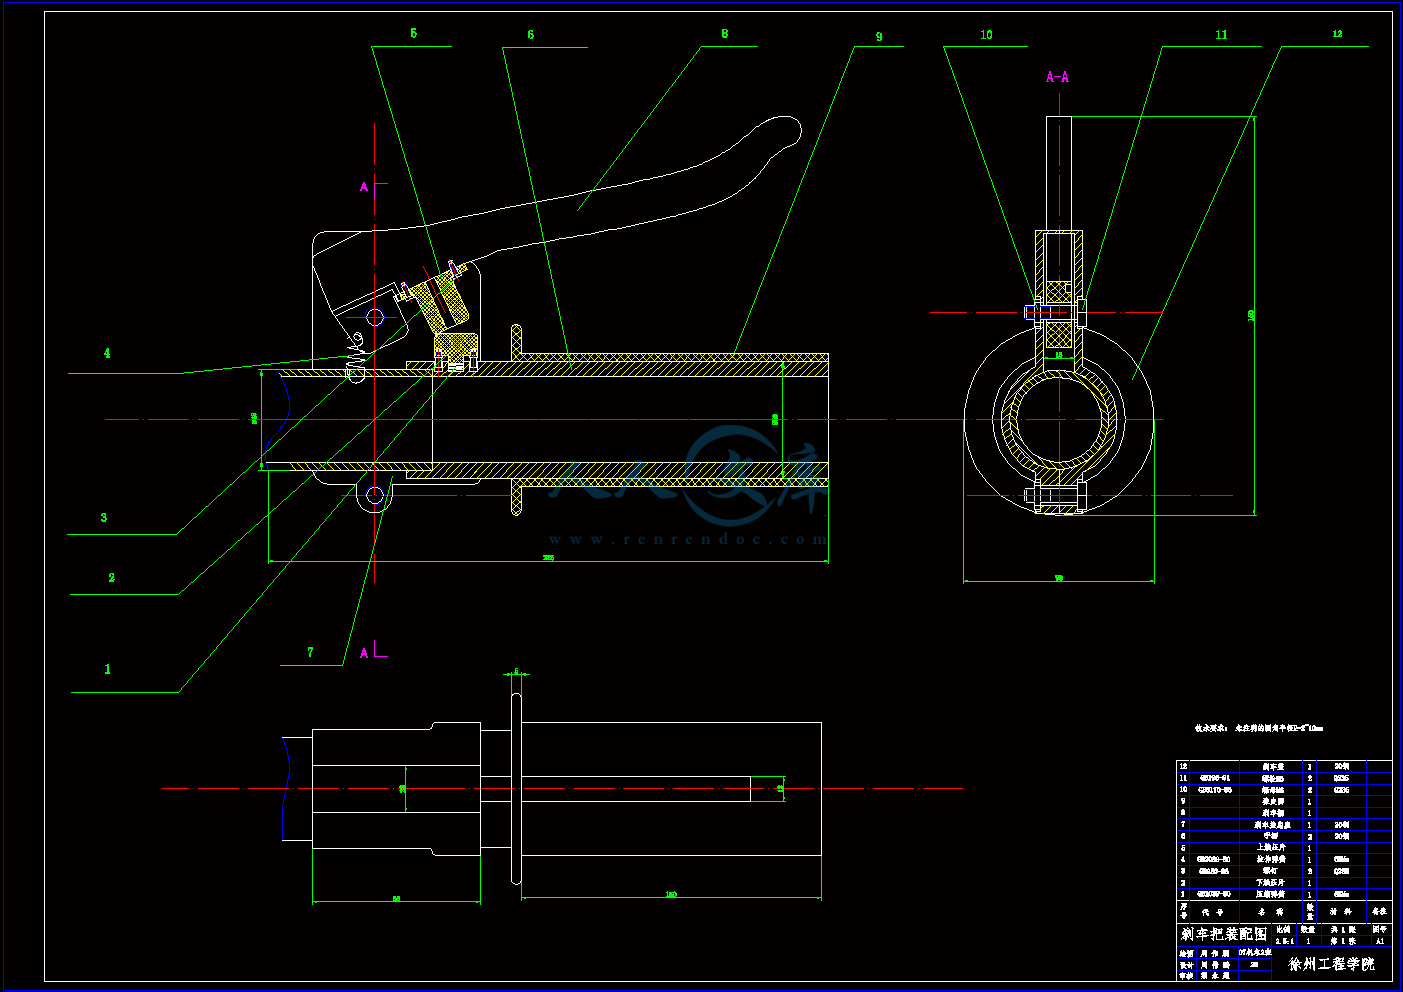
左刹车把装配图.dwg

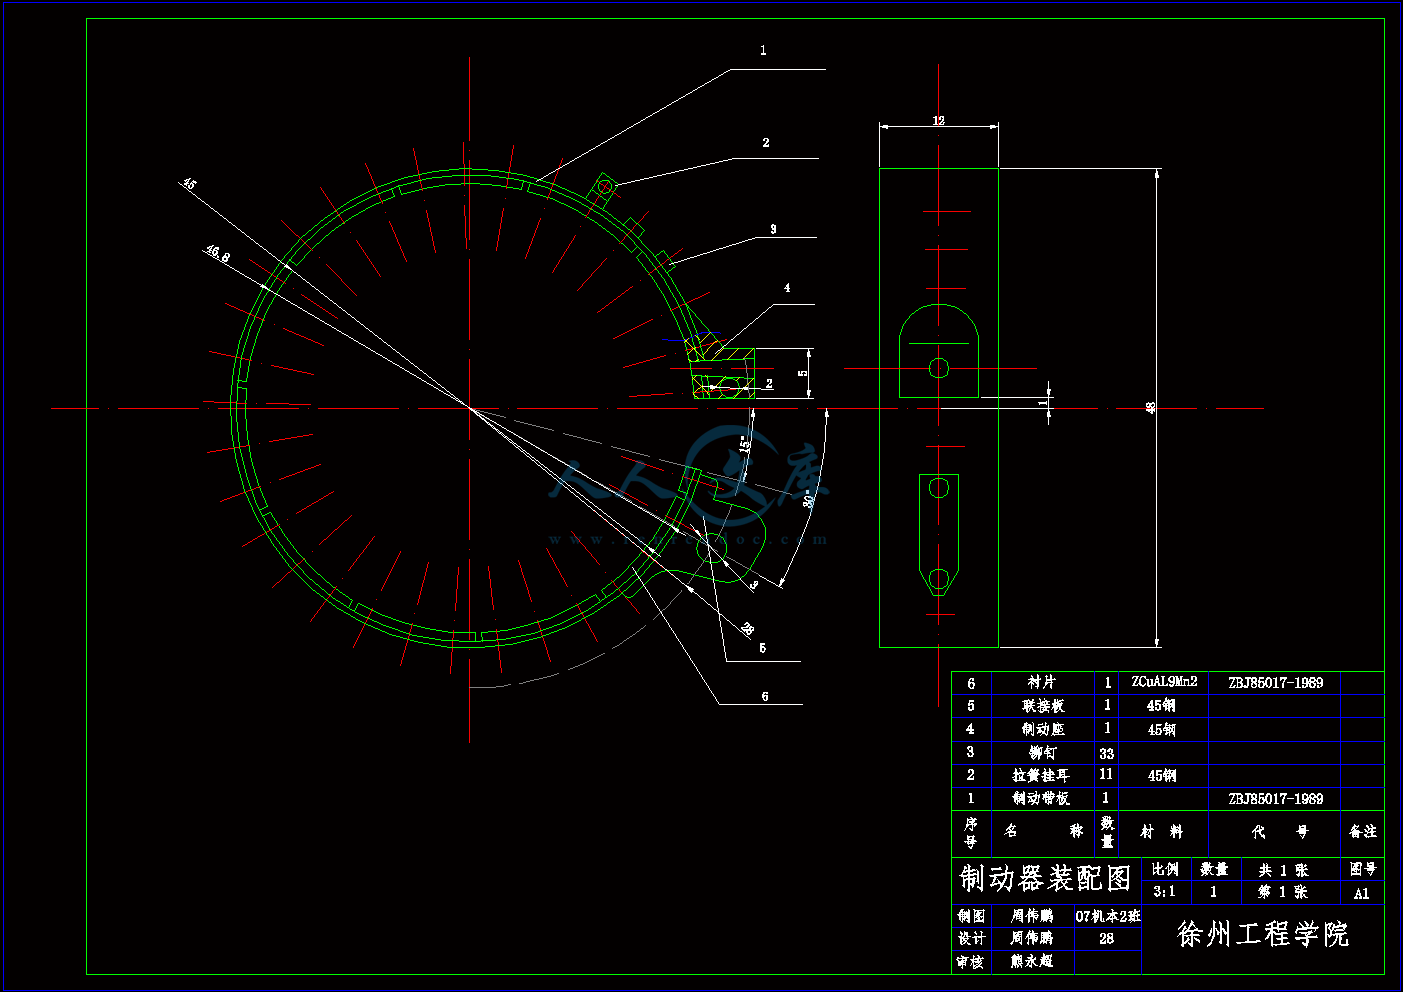
带式制动器.dwg

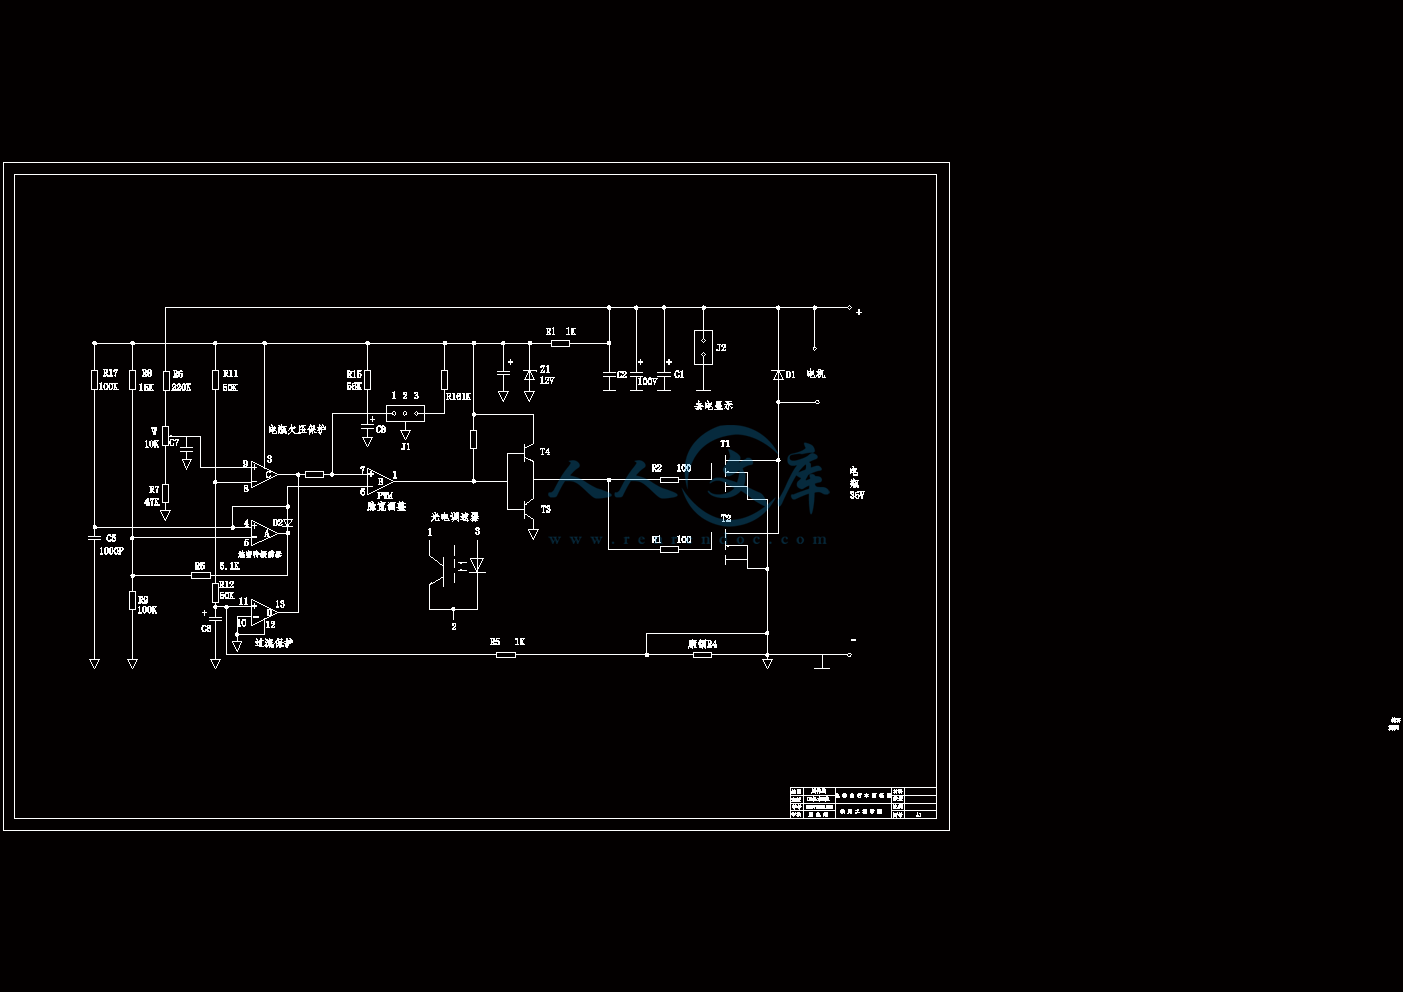
控制线路图.dwg

新型电动自行车及动力反馈制动系统设计说明书.doc

电动自行车原理图.dwg

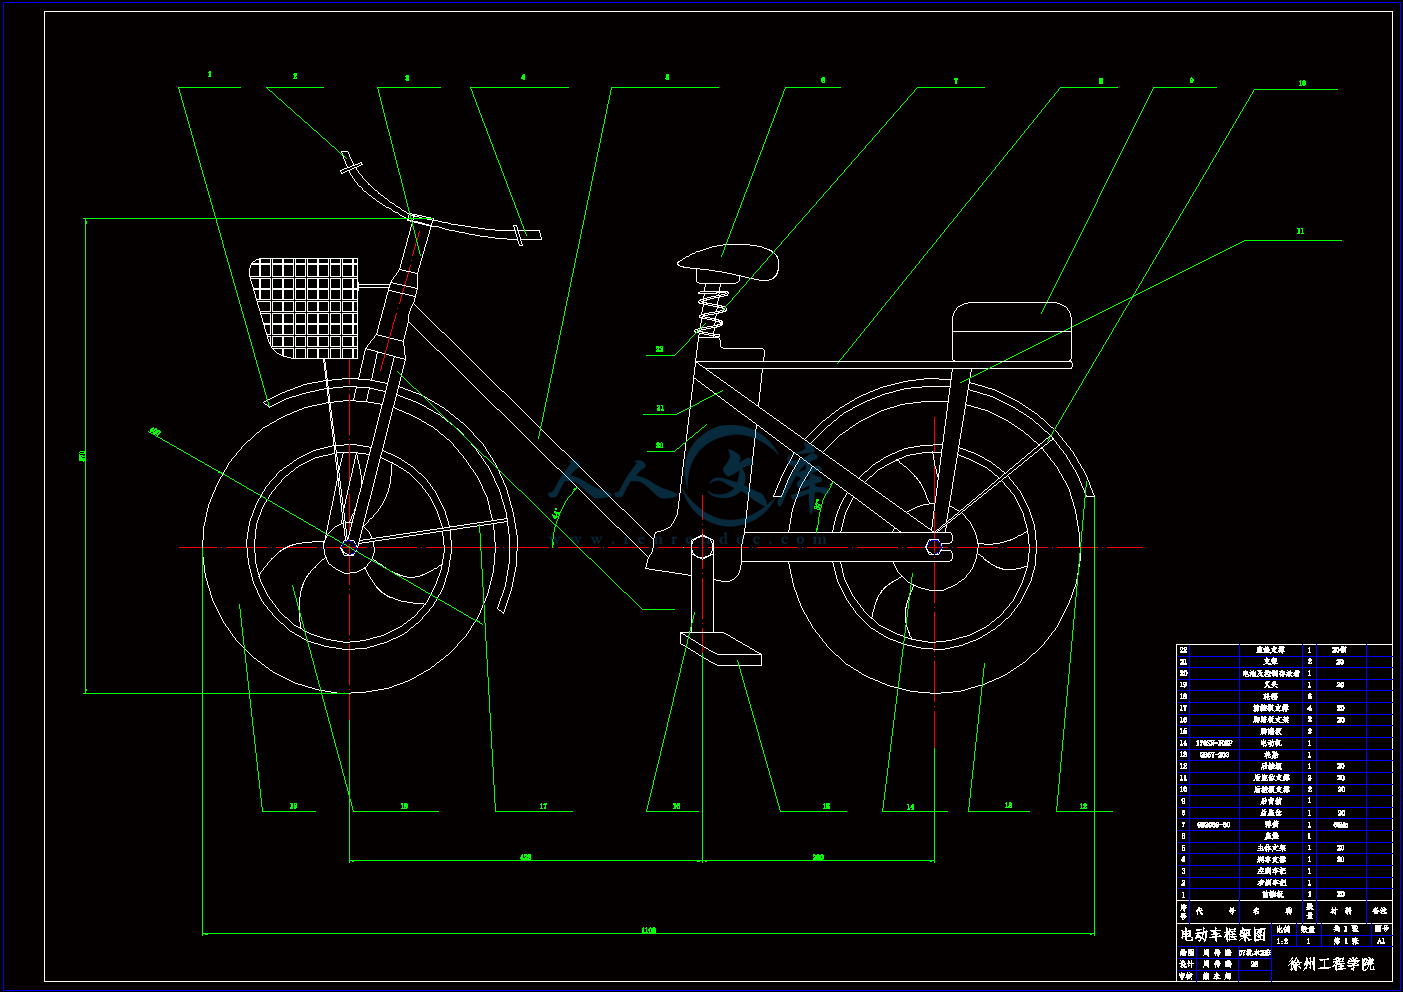
电动自行车框架图.dwg

论文.doc

链轮底座.dwg

链轮盖.dwg

飞轮.dwg

目       录

摘要I

AbstractII

1  绪论1

1.1 课题来源,目的,意义与该课题的市场前景1

1.2 有关电动自行车的概念1

1.2.1 什么是电动自行车1

1.2.2 电动自行车的种类1

1.2.3 电机2

1.2.4 电池2

1.2.5 控制器3

1.3 电动自行车整车参数的设计3

1.4 设计任务3

1.5 研究意义4

2 电动自行车动力性能分析5

2.1 电动车运行方程5

2.2 电动自行车的行驶力学6

2.2.1 车辆模型6

2.2.2 电动车阻力计算7

2.2.3 空气阻力8

2.2.4 电动车惯性力的计算8

2.2.5 电动车的牵引力计算9

2.3 电动自行车的动力性能10

2.3.1 自行车基本参数介绍11

2.4 制动系统11

2.4.1 电动自行车刹车分类11

2.4.2 制动力的分析与求解11

2.4.3 手动制动器的设计12

2.5 蓄电池的种类和结构14

2.6 动力传动系统设计15

2.6.1 驱动方式对两轮电动车性能的影响15

2.6.2 电动自行车驱动系统的构成16

2.6.3 无刷直流电动机驱动系统16

3 电动自行车的运行控制18

3.1 电动机的选择18

3.1.1 直流电动机的特点18

3.1.2 电动机容量选择的原则19

3.1.3 电动机的发热与冷却19

3.1.4 选择步骤:20

3.1.5 无刷直流电动轮毂的选型计算20

3.1.6 电动自行车的续行距离21

3.2 无刷电动机的调速控制系统22

3.2.1 直流电动机的机械特性22

3.2.2 脉宽调制(PWM)23

3.2.3 传感器23

3.3 电动车控制系统设计24

3.3.1 控制系统的组成24

3.3.2 控制系统设计方案24

4 电动自行车的能量回收28

4.1 制动模式与能量的分析28

4.2 能量回馈的控制策略29

4.3 电动自行车能量的消耗评价方法29

4.3.1 能量流分配关系及能量测量30

4.3.2 能耗影响因素分析30

4.4 制动效能及制动能量回收的约束条件30

4.4.1 自行车的制动效能30

4.5 制动能量回收控制算法31

4.5.1 制动能量回收的约束条件31

4.6 永磁无刷直流电机相关性能及其能量回馈制动原理32

4.6.1 永磁无刷直流电机及其基本工作原理32

4.6.2 直流电动机的制动方式33

4.6.3 永磁无刷直流电机能量回馈制动原理35

结论39

致谢40

参考文献41

电动自行车整车参数的设计

   在设计前先将文章中计算需要的数据假定如下:

   整车质量()    50

   重力加速度()   10

   滚动阻力系数()

   人重()         70

   车轮直径()     400

   后轴转子直径()  10

1.4 设计任务

   对电动自行车的运行状态进行了分析,分别对电动自行车的运行阻力、惯性力、再生制动力以及所需要的牵引力进行计算。

   利用现代电子技术及电动机发电反馈制动理论,设计一套能够在电气制动的同时,发电给电瓶充电的发电反馈制动系统。

   利用该系统能够实现将自行车及人体的动能通过电动机的发电运行状态转化为电能,并经过相应的处理和控制电路,达到给电瓶充电和自行车减速的双重目的。

   完成发电反馈制动系统机械连动机构、发电反馈制动电控系统、发电反馈回路的设计、电动机选型。

1  绪论

1.1 课题来源,目的,意义与该课题的市场前景

当今时代,电动自行车已经成为人们日常生活不可缺少的代步工具,改变了人们的生活方式提高了人们的生活质量。自上世纪以来,汽车工业的发展就开始面临两大难以回避的挑战:能源短缺与环境保护。根据目前世界石油总储量和年产量计算,石油资源最多再能支持三四十年的工业消费,再加上政治、局部战争等不稳定因素对能源安全的影响,汽车的燃料供应存在着潜在的隐患。此外汽车废气造成的大气污染日益严重。针对上述问题,现在电动汽车、电动自行车已经进入中国市场。

该课题的目的是通过对电动自行车制动能量的回收过程进行分析和研究,为提高制动能量回收能力提出解决方案。

该课题的意义:首先本设计的课题使我们对电动自行车有了进一步的了解,对制动能量再生有了新的认识,所谓制动能量再生,是指电动自行车减速制动时将其中一部分机械能转化为其他形式的能量这里是电能,并且将其充进电池。制动能量再生方法原理是先将电动自行车制动或减速时的一部分机械能转化为电能存储在电池中,同时产生一定的负荷阻力使电动自行车速度降低;当电动车再次起动或加速时再生系统又将存储的能量再次转化为电动自行车行驶时所需要的动能。这样就可以提高一次充电的续行距离,避免了不必要的能量损失。

1.2 有关电动自行车的概念

1.2.1 什么是电动自行车

电动自行车是以电池作为辅助能源,具有两个车轮,能实现人力骑行、电动或电助动功能的特种自行车。它虽然具有普通自行车的外表特征,但更主要的是,它是在普通自行车的基础上,安装电动机、控制器、电池、转把、闸把等操纵部件和显示仪表系统的、机电一体化的个人交通工具。

1.2.2 电动自行车的种类

电动自行车以其驱动力性质、整车结构及电动机驱动方式的不同,可以分成以下三种类型:

按驱动力性质分:有电动型和助力型两种。

按整车结构分:有两轮、三轮、电动轮椅三种。

按电动机形式及驱动方式分:有直驱车轮的轮毂式直流电动机、中轴链式驱动的柱式直流电动机、电动箱式驱动的柱式和盘式直流电动机。

1.2.3 电机

由于电动自行车要求的功率较小,所带有的能源有限,故希望电机的驱动系统的体积小、功率高,而其中以直流电机最为合适。目前,电动自行车所使用的电机大多数为有刷直流电动机,但是随着技术的进步与电子元件成本的不断下降,无刷直流电机将成为今后电动自行车的发展主流。

1、有刷直流电机

电动自行车上使用的有刷直流电机主要有两种:一是印制绕组电机,二是绕线盘式电机。前者的应用较后者多一点。有刷直流电机的优点是控制系统简单,成本较低,过载能力强,但需要换向器(整流子),影响电机的效率。

有刷直流电机又可以分为有齿和无齿两种。有刷有齿电机是一种高速电机,所谓“有齿”就是通过齿轮减速机构,将电机转速降低(国家标准规定电动自行车的转速不超过20)。由于高速电机通过齿轮减速,其特点是骑车者的感觉动力较强,而且爬坡的能力较强。但是电动轮毂是封闭的,只是在出厂前加注了润滑脂,用户很难进行日常保养。而且齿轮本身就有机械磨损,一年左右因为润滑不足导致齿轮磨损加剧,噪音增大,影响电机和电池的寿命。另一种是有刷无齿电机,这是一种外转子式电动机,没有齿轮减速机构,直接采用低速输出,消除了齿轮噪音,其电机输出转矩较有刷有齿电机要小,故动力性能和爬坡性能相对要弱一些。但运行安全,电刷磨损小、噪音小这是他的优点。

2、无刷直流电机

无刷直流电机由于没有电刷,不需要齿轮减速,从根本上消除了电刷磨损和齿轮磨损,不存在定期更换电刷,而且噪音很小。因此,他无干扰、寿命长、效率高、运行可靠、维护简单,且转速由于不受机械换向的限制,可在宽广的范围内平滑调速,与有刷直流电机相比成本低,但是控制系统复杂成本高。

无刷直流电机就起结构而言,是由电动机本体转子位置传感器以及电子电路换向组成。电动自行车上采用的是无刷电动轮毂电动机一般制成多相,如采用三相,它的电枢放在定子上,永磁磁极位于转子上。反映电动机定转子位置传感器输出信号,通过定子换向电路去驱动与电枢绕组联接的相应的功率器件,使电枢绕组依次馈电,从而在定子上产生一个跳跃式旋转磁场,拖动永磁转子旋转。随着转子位置的旋转,位置传感器通过电子换向线路不断的送出信号,以改变电枢绕组的通电状态,保证在一定的范围内定子磁场与转子磁场成正交关系,保持转矩连续不断的产生,输出机械功率,从而实现了无接触式电磁换向。

我国电动自行车用无刷直流电机的研制和生产厂家有上海微电机研究所、浙江卧龙集团等。今后二合一轮毂式无刷直流电机和无位置传感器无刷直流电机是电动自行车车用电机的发展方向。

1.2.4 电池

电池是电动车的动力源,电池质量直接影响电动自行车的行驶里程和寿命。目前电池选用的是铅酸电池、镍镉电池、镍氢电池等。

镍镉电池属碱性电池,我国产量较大,主要生产厂家有深圳比迪亚有限公司和上海电池厂等。镍镉电池可以快速充电,其过充、过放电性能均好,循环寿命较长,达2000次。但它的价格是铅酸电池的4.5倍,而且旧电池得不到很好的回收,会因重金属镉造成严重的污染。常用的是24V 5Ah,重量,一次充电续行里程,按标准的80%放电,寿命约500次。

1.2.5 控制器

内容简介:
阀控式铅酸蓄电池的失效模式在深放电电动自行车的应用摘要36或48V valve-regulated铅酸蓄电池电池在中国被广泛应用到电力来源的电动自行车或光线电动小轮摩托车。12V/10Ah阀控式铅酸蓄电池的失效模式已经通过在C2流量和100%的深度放电下蓄电池的使用寿命试验被研究。这个试验表明电池失效的主要原因是蓄电池的软化和脱落而不是单独的水分流失,效率复合或硫酸化等等。当电解质饱和度下降到一定范围内,高氧电流重组导致负极的去极化和正极的转移到一个更高的潜力。猛烈的氧化加速了电池的软化和使用寿命。2008年出版社B.V.保留所有权利。1介绍在过去的二十年间,大量精力用于研究阀控式铅酸电池在电池电动车和混合动力电动汽车中的应用。在中国,有超过13亿的人口。大多数人骑自行车去上班,2007年生产了65.5亿辆自行车。然而,在最近几年,越来越多的人使用电动自行车或光线电动小轮摩托车代替自行车。这些新的车却有着250W或350W电机的驱动下,蓄电池36或48V电池组,分别5,6。根据电机的力量使用,电池容量可12伏10,17或20Ah。举行的一定数量的电动自行车和摩托车电路到去年年底前提交至少达到60M。这大约相当于200M 12 V / 10Ah蓄电池、约260亿元。电池实际运行寿命通常在1-2年范围内。随着迅速发展的中国或亚洲经济,将需要更多的电动自行车和他们的电池,在未来的岁月中他们将有一个巨大的潜在市场,同时也对电动汽车的发展起到了推动作用。虽然有许多阀控式铅酸蓄电池的破坏形式,包括过早能量损失、网格腐蚀、软化、硫酸盐化、干燥、添加剂分解和微弱接触的分离器板等等,它们随不同的设计、制造和运行工况等因素而变化。在深层的循环研究中,界面的网格/活性物质在用电阻非常高时容易积累硫酸铅晶体,当一种正面的网格铅锑合金被铅镉锡铝合金所取代时形成一个障碍层。被称为“锑释放效应”和过早能量损失失效模式。虽然障碍层可以随着锡的容量超过1.2wt%时明显改善,但是容易受滥用条件如深度释放的影响。所以在中国大多数制造商使用铅-锑-镉合金作为正面的网格。然而,镉是有毒的必须清除掉。正面网格的腐蚀在这个自行车循环试验中与在浮球应用程序中相比不是严重的。高容量的钙和铝是的大大地加速了正面网格的腐蚀速度,虽然它有好的力学性能和铸造性能。在深度循环试验中,正板的活性物质经过大容积膨胀和收缩可以导致活性物质粒子间的接触不良。这就是过早能量损失失效模式通常发生在电动汽车电池的原因。它可以通过压缩堆栈板,优化正片的生产工艺和提高正片对负片活性粒子的比例使得显著提高。严重的负极板的硫酸化情况通常发生在电池工作在部分国家的主管或高氧率有大电流或重组时在负极板添加剂进行了高温条件下分解。这将克服在负极活性质量上大规模使用高含量的石墨。干燥主要与一个高充电电压和电流相联系,往往与电池的高温度相结合。在极端情况下,热失控可能需要一个非常低的电池电解液饱和度的地方。失水取决于格的成分,杂质,电池温度和充电电压。适宜的收费制度包括快速充电对于延长电池的循环寿命非常重要。对于电动自行车电池的实践操作,其放电电流取决于电机功率和加速过程。截止电压为10.5V。通常的收费为一个限流恒压一个晚上,一个星期两次或三次。有些充电器也使用了多步恒定电流充电。在标准测试中,然而,电动自行车电池的放电率在2小时至70%或100%的放电的深度,并在限流恒压充电。虽然阀控式密封铅酸蓄电池已被广泛应用于电动自行车,其循环寿命和性能仍有待进一步提高。在这项工作中,对12V/10Ah阀控式密封铅酸电池的制造技术进行了优化和对深循环执勤的故障模式进行了研究。2 实验测试电池为由七个正极,八个负极和吸收玻璃垫分离器所组成的12V/10Ah(C2的速率)阀控式密封铅酸电池。电网的正极和负极分别为铅0.065%钙1.2%锡0.003%铝和铅0.085%钙0.35%锡0.015%铝的合金。正极板和负极板中每公斤铅粉末含有45克和42克的硫酸。其明显的密度为每立方厘米4.34.4克。这花了48小时固化和干燥。然后进行组装的电池充满含有1.5%硫酸钠的密度为每立方厘米有1.25克的硫酸。该容器的形成是由在70小时内多步恒定的两个放电步骤电流充电的。电池的重量为4.25公斤。在循环试验中,这些电池在电流为5A放电一直到10.5V,在吸收一限流恒压为2.5A/14.4V达6小时,随后在环境温度为25摄氏度内再次以充电电流为0.8A的电流充电。电池的比能量达到32.6。当电池容量下降到7Ah时,循环测试被终止。为了测量电池的电阻,通过ArbinBT2000施加一个5A和1ms的短短的脉冲电流。在循环寿命试验后,电池被拆除和分析。该粉末X射线的正面和负面的活动量衍射共进行了一个MPD公司衍射(飞利浦)。通过扫描电子显微镜观察其外观。3 结果与讨论3.1 循环测试图1显示了在C2放电率下两个电池的放电量循环次数的依赖。在最初的周期,他们的能力增加,在28周期达到最大值11.55Ah。然后在250周期前它逐渐减小。之后,它变得相对稳定,但大约600周期后迅速下降。电池的循环寿命A和B是相似的,达到约680次。由于各种故障模式,板栅腐蚀,PAM软化,干燥,硫化或少收了等密切相关的电池充电,充电制度大大影响了测试电池的循环寿命。图2显示了在目前有限的循环寿命试验中的恒压充电电流和电池电压的变化。在第一阶段恒流(2.5A),在图2A中恒流时间随周期循环缩短。这是由于电池的容量逐渐下降。在图2B中上升的充电电压图表示了因失水和电池变性等导致的电池的极化电阻增大。在第二阶段恒压(14.4V)时,充电电流迅速下降并且达到非常小的值。然而,约在400周期后6 h尾巴电流开始显著增加,其详细的演变如图3。在电荷为0.8A的最后阶段,图2B显示作为循环试验所得充电电压先增大后减小。转折点出现在第50周期左右和充电电压达到16.68V。那么最大充电电压逐渐减小与电解液消耗或电解质的饱和,从而导致负极板的去极化下降。第570周期后,最高充电电压低于14.40V,这意味着这种低偏振可能导致少收和硫酸铅在负极板的积累。图3显示的是在图2A中的恒压结束时的充电电流(6小时)的依赖性及在图2B恒流结束图(7小时)的电压。在实践中,这种充电电流反应了氧气的重组率或充电效率,这种充电电压反应了极化或有效电荷。从图3发现电池充电电压非常高,充电电流在最初的50个循环中从0.12A提高到0.39A。这表明在此期间电池具有高饱和的电解质和非常低的氧复合电流。然后,充电电压下降很快在14.615.0V,直到400周期范围稳定,充电电流为0.2110.388A范围之外。这是一种比较理想的循环过程,其中相对较高的电压不仅保证了完全的充电,也没有更多的损失发生。在此之后,尤其是600周期后,在恒压阶段充电电流迅速增加,而充电电压逐渐下降从14.08到14.09。在这个阶段,在大约250个周期内电解液的饱和度仅仅下降了1.2%(从88.2%到87.0%)。Kirchev和巴甫洛夫发现当电解液的饱和度低于约87%时,负极活性物质表面得液膜厚度和氧气的重组率急剧变化。在这个时间,所以仅仅只有饱和的电解质略有下降会导致非常高氧复合电流和负极板的去极化。电池少充电可能会发生。它表明该电池难以完全在充电时间为7小时内充电14.6V,这将导致在随后的周期内有电池的明显降解。电池的内阻是关系到电池的结构,电解液的饱和度,板栅腐蚀,负极活性物质颗粒之间的联系,活性物质硫酸化和反应面积等等。由于内部电阻为新的或正常经营的小电池,电池在充电和放电结束内阻的变化情况只有在循环寿命试验后半个周期才知晓如图4。放电电阻约为充电电阻的四倍。第550次循环后它们的电阻大大增加,尤其是最后20个周期。显然,电池故障与电池内部迅速崛起的阻力是密切相关的。从图3中可以看出氧复合电流上升的时期急剧下降。这进一步导致了负极板得去极化,对正极板转到较高的潜力和更加猛烈析氧。因此,正极板上的主动物质颗粒间的接触变差及电阻迅速增大,可加速电池容量的下降和循环寿命的结束。3.2 过充电及加水试验经过700个周期后C2的容量仅为6.03Ah。为了分析电池失败的原因,在循环寿命结束后电池被分为两个6V的电池。它们经历过充电,加水和电阻测量。由于在图2A中的670周期内充电电流为在14.4V的恒定电压下达到了1.8A,使得随后的0.8A恒流充电不能完全充电。要查看电池是否少充电,进行两个周期的最后1小时0.8A的充电改为2小时2A的充电。第一次充电量为放电容量的2.53倍,但是接下来的放电容量仅为6.45Ah及只有7%的复出。为了了解电池故障是否是由于过度失水,在电池完全充电后每个元件充满了约18毫升的水。第二个C2的容量比第一个少,仅只有5.58Ah。这表明,水的损失和和少充电不是电池失败的主要原因。图5显示的是加入上述水前后充电电流和电压的变化。加水之前,它们的曲线是正常的。但是加水后,最高充电电压只有达到每单元2.349V,使得充电电流始终保持在2.5A。在一个洪水铅酸电池在2.5A的充电电压的基础上,可以推定在电池内部有短路发生。图6显示了在其保质期内完全充电的电池电压的下降。它的容量是在20小时内是完全自我放电的。充电的硫酸溶液中显示了一个小小的黑色的颜色而不是透明的。它表明正极板发生了严重的软化。大量的正极活性物质粒子流进入了高充电电流的电解质。这些二氧化铅颗粒可作为树突状析出铅,通过隔板的形式传递到微小的负极板导致短路。图。7显示了在加水前后充电和放电三次失败元件内阻的变化。在充电过程中,内阻逐渐降低,两条曲线是相同的。在放电,内阻急剧增加,并在最后加水,是深受影响。电池容量从7.50下降到5.83Ah。因此,类似上述的结果,电池故障不是由于失水造成的。相反,阻碍了再滥加水,这可能会增加正极活性物质内部的压力,并可能导致其脱落的氧气在通过隔板逃脱其外微孔。又过了三个周期,三个单元的充电电压也只有在6.72V的2.5A的恒定电流。因此,内部短路的地方也可以。3.3 拆解分析Awas拆除电池循环寿命测试后已经结束。图8显示板的照片板和其积极和消极板。该板块和负极板有综合结构。虽然正栅极一些肋骨被严重腐蚀,它的框架仍然良好,具有相对的正极板良好的机械性能。它是发现,然而,严重的会出现软化,尤其是在正极活性物质在正极板的上部。图9表明,AGM隔板面临的正极板的活性物质颗粒很多,而AGM隔板面对负极板是正常的。这是由于该粒子的正极活性物质成为彼此之间日益变差与小周期和他们的联系事实上,在软化和脱落造成的。为了了解是否负极板失败,一个失败的电池负极板之间放置了两个普通正极板,由PE隔板隔开,并把他们过度硫酸溶液中的比重为1.28付诸表决。然后根据细胞是循环的循环寿命试验的条件。也就是说,在0.36A2.4V的充电6小时和恒流0.114A放置1小时,然后排放到-0.8V在0.7A的负电位。图10显示了在周期负极板的卷土重来的能力。在首次放电容量非常低,因为负极板在放电状态,当电池被拆除。它是发现,负极板的容量可以在几个周期你很容易赶回来。因此,电池故障不是由于硫酸或负极板钝化。图11是对失败的电池完全充电正极活性物质的扫描电镜图。图11A显示了典型的正极活性物质的coralloid结构。大孔隙的大小在10米范围内还有一个很大的框架微孔。图11B是图11A的扩大图,这表明正极活性物质的颗粒大小为0.3-0.5米,他们之间的联系很差。正极活性物质具有高结晶度,并已失去了其水化结构,不利于电池的容量和循环寿命。图11C显示了正极活性物质的扫描电镜在其他位置。有一些粒子差结晶或水合结构和高结晶度和规模7-8,这是硫酸铅晶体的一些大型晶体。因此,有两种结构的正极活性物质。其一是一些硫酸铅晶体积累。另一种是之间有微弱联系的coralloid活性物质颗粒的结构。正极活性物质已经软化和明显脱落。图12显示充满电的SEM在负极板的上部和下部的扫描电镜。可以看出,有两种结构。他们是硫酸铅和铅晶体。前者是完美的晶体,而后者有一个海绵状或树枝状结构。虽然SEM完全充电后,在负极板氧重组导致硫酸铅积累。结果发现,在负极板上部硫酸铅晶体是更大一点,与在下部比较。这是由于不断循环测试中,活性物质是充电的,更在下部发生时,电解液分层出来。在上半部分,另一方面,更多的氧气发生重组,其中较大的硫酸铅晶体可以通过电化学和化学反应形成的过程。对于实际阀控式密封铅酸蓄电池用电解液分层,但是,硫酸或大硫酸铅晶体,通常出现在下部因为它是自放电的。因此,由于它是小极板所以这个测试电池电解液只有非常轻的分层。人所共知的是,刚形成的正面和负面的板块主要包括二氧化铅和铅。循环寿命测试后,图13显示了它们的正极活性物质和图谱完全充电状态。只有二氧化铅在图13A衍射峰。由于X射线衍射仪的分辨率观察到二氧化铅和硫酸铅。化学分析表明,在撕裂式正极板上二氧化铅含量达到89。因此,硫酸铅含量非常低,尽管正极活性物质在图11C被发现。在负极板,然而,在海绵铅旁边还有许多硫酸铅晶体。该化学分析也表明36硫酸铅在NAM中被发现。所有这一切都归功于氧气重组。4 结论在这项工作中,在12 V/10Ah阀控式密封铅酸电池的电动自行车应用的设计和制造。进行测试的周期在C2放电率和100DOD的。失败的电池测量和分析表明,拆解电池故障不是由于个别失水,板栅腐蚀,电解液分层,重组效率或硫酸盐化。主要的原因是软化和正极活性物质的脱落。当电解质饱和度下降到一定程度后,迅速与氧的重组,从而导致负极板的去极化和正极板转变为高电位电流增加。因此,氧的演化变得越来越激烈,活性物质粒子之间的联系变得微弱和加速软化。虽然许多硫酸铅在NAM中由于氧气重组被发现,它们不会钝化负极板,当负电极极化增大时还能减少硫酸铅。字典 - 查看字典详细内容Journal of Power Sources 191 (2009) 127133Contents lists available at ScienceDirectJournal of Power Sourcesjournal homepage: /locate/jpowsourFailure modes of valve-regulated lead-acid batteries for electric bicycleapplications in deep dischargeYonglang Guoa, Shengqun Tanga, Gang Mengb, Shijun YangbaCollege of Chemistry and Chemical Engineering, Fuzhou University, Fuzhou 350108, PR ChinabHubei Camel Storage Battery Co. Ltd., Gucheng 441705, PR Chinaa r t i c l ei n f oArticle history:Received 26 June 2008Received in revised form 20 August 2008Accepted 21 August 2008Available online 29 August 2008Keywords:Cycle lifeElectric bicycleFailure modesSofteningValve-regulated lead-acid batteriesa b s t r a c tThe 36 or 48V valve-regulated lead-acid (VRLA) battery packs have been widely applied to the powersources of electric bicycles or light electric scooters in China. The failure modes of the 12V/10Ah VRLAbatteries have been studied by the cycle life test at C2discharge rate and 100% depth of discharge (DOD).It indicates that the main cause of the battery failure in this cycle duty is the softening and shedding ofpositive active mass (PAM) rather than individual water loss, recombination efficiency or sulfation, etc.When the electrolyte saturation falls to a certain extent, the high oxygen recombination current leads tothe depolarization of the negative plate and the shift of the positive plate to a higher potential. The violentoxygen evolution accelerates the softening of PAM and the end of cycle life. 2008 Elsevier B.V. All rights reserved.1. IntroductionIn the last two decades, much effort has been devoted to thestudy of valve-regulated lead-acid (VRLA) batteries in the applica-tions of electric vehicles (EV) and hybrid EVs 15. In China, thereis a population of more than 1.3 billion. Most people go to work bybicycle and 65.5 million bicycles were produced in 2007. In recentyears, however, more and more people use electric bicycles or lightelectric scooters to substitute for bicycles. These new vehicles havea 250 or 350W electromotor driven by a 36 or 48V VRLA batterypack, respectively 5,6. Based on the power of the electromotorused,thebatterycapacityis12V10,17or20Ah.Theheldamountofthe electric bicycles and light electric scooters at least reaches 60Mtill the end of last year. It corresponds to about 200M 12V/10AhVRLA batteries, or about RBM 26 billion. The practical operating lifeof batteries is normally in the range of 12 years. With the rapiddevelopment of Chinese or Asian economy, more electric bicyclesand their batteries will be needed and they have a huge potentialmarket in the coming years, which also promotes the developmentof EV.Although there are many failure modes of VRLA batteries,including premature capacity loss (PCL), grid corrosion, softening,Corresponding author. Tel.: +86 591 8789 2893; fax: +86 591 8807 3608.E-mail address: yguo (Y. Guo).sulfation, drying out, additive decomposition and poor separator-plate contact, etc., they vary with different designs, manufacturingand operating conditions 715. In the deep cycle duty, the inter-face of the grid/active mass easily accumulates the lead sulfatecrystals with very high resistance and forms a barrier layer whenPbSb alloys in the positive grid are substituted by PbCdSnAlalloys. It is called the “antimony-free effect” and the PCL-1 failuremode 7,8. Although the barrier layer can be obviously improvedwith the application of Sn content more than 1.2wt.%, it is sus-ceptible to the abuse conditions such as deep discharge. So mostmanufacturers in China use PbSbCd alloys as positive grid. How-ever, Cd is poisonous and must be excluded. The corrosion ofpositive grids in the cycle duty is not heavy as compared with thatin the float applications. The high contents of Ca and Al acceleratethecorrosionrateofpositivegridsgreatly,althoughtheyhavegoodmechanicalpropertiesandcastability.Theactivemass(AM)ofpos-itiveplatesundergoesgreatvolumeexpansionandshrinkageinthedeep cycle duty, which can lead to poor contact between AM par-ticles 8,9. This is the PCL-2 failure mode often taking place in theEV batteries. It can be greatly improved by compressing the platestack,optimizingthemanufacturetechnologyofpositiveplatesandincreasing the ratio of positive to negative AM. The serious sulfa-tion of negative plates often occurs when the battery operates atthe high rates in a partial-state-of-charge (HRPSoC) or has a highcurrent of oxygen recombination or when the additives at nega-tive plates are decomposed under the high temperature condition1,10,11. It will be overcome with the use of high content graphite0378-7753/$ see front matter 2008 Elsevier B.V. All rights reserved.doi:10.1016/j.jpowsour.2008.08.059128Y. Guo et al. / Journal of Power Sources 191 (2009) 127133in negative active mass (NAM) 12. Drying out is mostly connectedwith a high charge voltage and current, often in combination withhigh battery temperature. In the extreme cases, thermal runawaymay take place for a battery with very low electrolyte saturation.Water loss depends on the grid compositions, impurities, batterytemperature and charge voltage 8. The suitable charge regimeincluding fast charge is very important for prolonging the batterycycle life 13. For the practice operating of electric bicycle batter-ies, their discharge current depends on the electromotor powerand the accelerating processes. The cutoff voltage is 10.5V. Theyare normally charged at a current-limited constant voltage (CCCV)(2A/14.8V)foronenight,twoorthreetimesperweek.Somecharg-ers also use the multi-step constant current charge. In the standardtest, however, the electric bicycle batteries are discharged at a 2hrate to 70% or 100% depth of discharge (DOD) and charged at thecurrent-limited constant voltage.Although the VRLA batteries have been widely used in electricbicycle, their cycle life and performance still need to be furtherimproved.Inthiswork,themanufacturetechnologiesof12V/10AhVRLA batteries were optimized and the failure modes in the deepcycle duty were investigated.2. ExperimentalThe test battery was 12V/10Ah (C2rate) VRLA batteries com-posedofsevenpositiveandeightnegativeplatesandtheabsorptiveglass mat (AGM) separator. The positive and negative gridswere Pb0.065% Ca1.2% Sn0.003% Al and Pb0.085% Ca0.35%Sn0.015% Al alloys, respectively. The positive and negative pastescontained 45 and 42g H2SO4per kg lead powder. Their apparentdensities were 4.34.4gcm3. It took 48h for their curing and dry-ing. Then the batteries were assembled and filled with 1.25gcm3H2SO4containing 1.5% Na2SO4. The container formation was con-ducted by the multi-step constant current charge regime with twodischarge steps within 70h. The battery weight was about 4.25kg.In the cycle test, the batteries were discharged at 5A (C2rate) to10.5V (100% DOD) and charged at a current-limited constant volt-age of 2.5A/14.4V for 6h, followed by charging at 0.8A for 1hagain at ambient temperature of about 25C. The specific energy ofthe battery reaches 32.6Whkg1. The cycling test was terminatedwhen the battery capacity fell to 7Ah (70% rate capacity). In orderto measure the battery internal resistance, a short current pulsewith 5A and 1ms was exerted by Arbin BT2000 instruments. Afterthe cycle life test, the batteries were torn down and analyzed. ThepowderX-raydiffraction(XRD)ofpositiveandnegativeactivemass(PAM and NAM) were carried out by a XPert Pro MPD Diffractome-ter(Philips).Theirappearancewasobservedbyascanningelectronmicroscope (SEM, Philips, XL30ESEM-TEP).3. Results and discussion3.1. Cycle testsFig. 1 shows the dependence of the discharge capacity of twobatteries on cycle number at C2discharge rate. In the initial cycles,their capacity increases and reaches the maximum, 11.55Ah, in the28thcycle.Thenitdecreasesgraduallybeforethe250thcycle.Afterthat,itbecomesrelativelystable,butitdropsquicklyafteraboutthe600th cycle. The cycle life of battery A and B is similar and reachesabout 680 cycles.Since in various failure modes, the grid corrosion, PAM soften-ing, drying out, sulfation or undercharge, etc. are closely relatedto the battery charge, the charge regime affects the cycle life of thetestbatteriesgreatly1618.Fig.2showsthechangesofthechargeFig. 1. Evolution of discharge capacity of two batteries in the cycles at 100% DOD.current and battery voltage at the current-limited constant voltagein the cycle life test. In the first constant current stage (2.5A), theconstantcurrenttimeinFig.2Ashortenswiththecycles.Itisduetothe gradual falling of the battery capacity. The rising of the chargevoltage in Fig. 2B indicates the increase of the battery polarizationresistance due to water loss and battery degeneration, etc. In thesecond constant voltage stage (14.4V), the charge current dropsFig. 2. The changes of (A) charge current and (B) charge voltage at the current-limited constant voltage in different cycles.Y. Guo et al. / Journal of Power Sources 191 (2009) 127133129Fig. 3. Evolutions of charge current at 6h and charge voltage at 7h in Fig. 2.quickly and reaches very small value. However, the tail current at6h begins to increase obviously after about the 400th cycle andits detail evolution is shown in Fig. 3. At the final stage of chargeat 0.8A, Fig. 2B shows that the charge voltage at first increases andthendecreasesasthecycletestproceeds.Theturningpointappearsaboutinthe50thcycleandthechargevoltagereaches16.68V.Thenthe maximum charge voltage decreases gradually with the elec-trolyte consumption or the decrease of the electrolyte saturation,which leads to the depolarization of the negative plate. After the570th cycle, the maximum charge voltage is lower than 14.40V. Itmeans that such low polarization may result in the underchargeand the accumulation of PbSO4at the negative plate.Fig. 3 shows dependence of the charge current at the end ofconstant voltage (6h) in Fig. 2A and the voltage at the end of con-stant current (7h) in Fig. 2B on the cycle number. In practice, thischarge current responses to the rate of oxygen recombination orcharge efficiency and the charge voltage responses to the polar-ization or effective charge. It is found from Fig. 3 that the batterycharge voltage is very high and the charge current increases from0.12 to 0.39A in the initial 50 cycles. It indicates that the batteryhas high electrolyte saturation and very low oxygen recombinationcurrent in this period. Then the charge voltage drops very quicklyand is stabilized in the range of 14.615.0V till the 400th cycle,Fig. 4. The changes of the battery internal resistance at the end of charge and dis-charge in the cycles.Fig. 5. The changes of voltage and current when the three failed cells were chargedbefore and after adding water.Fig. 6. The voltage falling of three cells during the shelf after adding water and afew cycles.Fig. 7. The changes of the internal resistance in the charge and discharge of threecells before and after adding water.130Y. Guo et al. / Journal of Power Sources 191 (2009) 127133Fig. 8. The photographs of the plate stack and its positive and negative plates of failed battery A.and the charge current lies in the range of 0.2110.388A. This is arelatively ideal cycle process, in which the relatively high voltagenot only ensures the full charge and but also no more water lossoccurs. After that, especially the 600th cycle later, the charge cur-rent at constant voltage stage increases rapidly while the chargevoltage decrease gradually from 14.68 to 14.09V. In this stage, theelectrolyte saturation only decreases by 1.2% (from 88.2% to 87.0%)in about 250 cycles. Kirchev and Pavlov 19 found that the liquidfilm thickness on the surface of NAM and oxygen recombinationrate change sharply when the electrolyte saturation is lower thanabout 87%. At this time, therefore, only a little decrease of the elec-trolyte saturation will result in very high oxygen recombinationcurrent and the depolarization of the negative plate. And the bat-tery undercharge may occur. It also indicates that the battery isdifficult to be fully charged at 14.6V for 7h charge time, which willlead to the obvious degradation of the batteries in the subsequentcycles.The battery internal resistance is related to the battery struc-ture, electrolyte saturation, grid corrosion, contact between PAMparticles, passivation, AM sulfation and reaction area, etc. Since theinternal resistance is small for a new or normally operating bat-tery, the changes of the battery internal resistance at the end ofcharge and discharge were measured only in the later half of cyclelife test and shown in Fig. 4. The discharge resistance is about fourFig. 9. The torn-down AGM separator from the failed battery.Y. Guo et al. / Journal of Power Sources 191 (2009) 127133131times the charge resistance. And their resistance increases greatlyafter the 550th cycle, especially the final 20 cycles. Apparently, thebattery failure is closely related to the rapid rising of the internalresistance. It can be seen from Fig. 3 that the oxygen recombina-tion current goes up sharply in the period. This further leads to thedepolarizationofthenegativeplate,theshiftofthepositiveplatetohigher potential and more violent evolution of oxygen. As a result,the contact between PAM particles becomes poor and the resis-tance increases rapidly, which can accelerate the battery capacityfalling and the end of the cycle life.3.2. Overcharge and adding water testsThe C2capacity of battery A was only 6.03Ah after 700 cycles.In order to analyze the causes of the battery failure, the batterywas divided into two 6V batteries (three cells) after the end ofthe cycle life. They went through the overcharge, adding water andresistance measurements. Since the charge current at the constantvoltage of 14.4V has reached 1.8A in the 670th cycle in Fig. 2A, thesubsequent constant charge of 0.8A cannot make the battery fullycharged. To see whether the battery is undercharged, the final 0.8A1h charge was changed into 2A 2h charge and two cycles wereperformed. The first charge amount is 2.53 times the previous dis-charge capacity, but the next discharge capacity is only 6.45Ah andhas the comeback of only 7% capacity. In order to know whetherthe battery failure is due to excessive water loss, each cell wasfilled with about 18ml water after the battery was fully charged.The second C2capacity is only 5.58Ah, less than the first capacity.It indicates that the water loss and undercharge are not the majorcauses of the battery failure.Fig.5showsthechangesofthechargecurrentandvoltagebeforeandafteraddingwatermentionedabove.Beforeaddingwater,theircurves are normal. But after adding water, the maximum chargevoltage only reaches 2.349V per cell so that the charge currentalways keeps the limited value of 2.5A. Based on the charge volt-age at 2.5A for a flood lead-acid battery, it can be presumed thatthe internal short circuit takes place in the battery. Fig. 6 showsthe voltage decline of the fully charged battery during its shelf. Itscapacity was completely self-discharged within 20h. The H2SO4solution after charging shows a little black color, instead of beingtransparent. It indicates that severe softening occurs at the posi-tive plate. A lot of PAM particles shed and enter into the electrolyteat high charge current. These PbO2particles can be precipitated atFig. 10. The capacity comeback of the negative plate of the failed battery in thecycles.the negative plate as dendritic lead which passes through the AGMseparator to form the tiny short circuit.Fig. 7 shows the changes of the internal resistance in the chargeanddischargeofthethreefailedcellsbeforeandafteraddingwater.During charging, the internal resistance decreases gradually andtwo curves are the same. During discharging, the internal resis-tance increases sharply at the end and it is greatly affected byadding water. The battery capacity decreases from 7.50 to 5.83Ah.So similar to the results above, the battery failure is not caused bywater loss. On the contrary, the addition of water hinders the oxy-genescapefromthemicroporesinPAMduringovercharging,whichcan increase the internal pressure in PAM and may cause its shed-ding.Afteranotherthreecycles,thechargevoltageofthethreecellsFig. 11. SEM of active mass in different parts of positive plate of the failed battery.(A) 500, (B) 10,000 and (C) 1000.132Y. Guo et al. / Journal of Power Sources 191 (2009) 127133only reaches 6.72V at the constant current of 2.5A. So the internalshort circuit can also take place.3.3. Teardown analysisBatteryAwastorndownafterthecyclelifetestwasended.Fig.8shows the photographs of the plate stack and its positive and neg-ative plates. The plate stack and negative plate had the integratedstructures. Although some ribs of the positive grid were severelycorroded, its frame was still well and the positive plate had rel-atively good mechanical property. It is found, however, that thesevere softening appears in PAM, especially in the upper part of thepositive plate. Fig. 9 indicates that the AGM separator facing posi-tive plate glues a lot of PAM particles and that the AGM separatorfacing negative plate is normal. This is due to the fact that the PAMparticles become increasingly small with the cycles and their con-tact among one another becomes poor, resulting in the softeningand shedding.In order to know whether the negative plate fails, one negativeplate of the failed battery was placed between two normal positiveplates, separated by PE separator, and they were put into excessiveH2SO4solution of 1.28 specific gravity. And then the cell was cycledaccording to the conditions of the cycle life test. That is, charge at0.36A2.4Vfor6handatconstantcurrentof0.114Aforanother1h,then discharge to the negative potential of 0.8V (vs. Hg2SO4/Hg)at 0.7A. Fig. 10 shows the capacity comeback of the negative platein the cycles. The very low capacity in the first discharge is becausethe negative plate was in a discharge state when the battery wastorn down. It is found that the capacity of the negative plate canFig. 12. SEM of active mass in (A) the upper and (B) lower parts of negative plate ofthe failed battery. (A) 2000 and (B) 2000.come back easily in several cycles. Therefore, the battery failure isnot due to the sulfation or passivation of the negative plate.The SEM of the fully charged PAM of failure battery A are shownin Fig. 11. Fig. 11A shows the typical coralloid structure of PAM. Thesize of big pores is in the range of 1020?m. There are also a lotof micropores on the framework. Fig. 11B is an enlarged Fig. 11A,which indicates that size of the PAM particles is 0.30.5?m andtheir contact among one another is very poor. The PAM has a highcrystallinity and has lost its hydrated structure, which is unfavor-abletothebatterycapacityanditscyclelife.Fig.11CshowstheSEMof PAM in the other position. There are some particles with poorcrystallinityorhydratedstructureandsomelargecrystalswithhighcrystallinity and 78?m in size, which are PbSO4crystals. There-fore, the PAM has two structures. One is the accumulation of somePbSO4crystals. The other is the coralloid structure with poor con-tactamongAMparticles.ThePAMhassoftenedandshedobviously.Fig. 12 shows the SEM of the fully charged NAM in the upperand lower parts of the negative plate. It can be seen that there aretwo structures. They are PbSO4and Pb crystals. The former are per-fect crystals and the latter have a spongy or dendritic structure.Although the NAM is fully charged, the oxygen recombination atthe negative plates causes the PbSO4accumulation. It is found thatthe PbSO4crystals in the upper part of the negative plate are a littlelarger as compared with those in the lower part. This is due to thecontinual cycle test in which more AM is charged and dischargedin the lower part when the electrolyte stratification occurs. In theupper part, on the other hand, more oxygen recombination takesplace, in which bigger PbSO4crystals can be formed by electro-chemical and chemical reaction processes 20. For the practicalVRLA batteries with electrolyte stratification, however, the sulfa-Fig. 13. The XRD patterns of (A) PAM and (B) NAM of the failed battery.Y. Guo et al. / Journal of Power Sources 191 (2009) 127133133tionorbigPbSO4crystalsnormallyappearinthelowerpartbecauseof its self-discharge 21. Therefore, this test battery only has verylight electrolyte stratification due to its small plates.It is well known that the AM of the freshly formed positive andnegative plates mainly consists of ?/?-PbO2and Pb, respectively22,23. After the end of cycle life test, Fig. 13 shows their XRDpatterns of PAM and NAM in a fully charged state. There are only ?-PbO2diffractionpeaksinPAMinFig.13A.No?-PbO2andPbSO4areobserved due to the resolution of XRD diffractometer. The chemicalanalysis indicates that the content of PbO2in AM of the torn-downpositive plate reaches 89%. Therefore, the content of PbSO4is verylow in PAM although it is found in Fig. 11C. At the negative plate,however, there are a lot of PbSO4crystals besides spongy lead. Thechemical analysis also shows 36% PbSO4were found in NAM. Allthis is attributed to the very high current of oxygen recombination.4. ConclusionsIn this work, a 12V/10Ah VRLA battery in the electric bicy-cle applications was designed and manufactured. The cycle testwas conducted at C2discharge rate and 100% DOD
温馨提示:
1: 本站所有资源如无特殊说明,都需要本地电脑安装OFFICE2007和PDF阅读器。图纸软件为CAD,CAXA,PROE,UG,SolidWorks等.压缩文件请下载最新的WinRAR软件解压。
2: 本站的文档不包含任何第三方提供的附件图纸等,如果需要附件,请联系上传者。文件的所有权益归上传用户所有。
3.本站RAR压缩包中若带图纸,网页内容里面会有图纸预览,若没有图纸预览就没有图纸。
4. 未经权益所有人同意不得将文件中的内容挪作商业或盈利用途。
5. 人人文库网仅提供信息存储空间,仅对用户上传内容的表现方式做保护处理,对用户上传分享的文档内容本身不做任何修改或编辑,并不能对任何下载内容负责。
6. 下载文件中如有侵权或不适当内容,请与我们联系,我们立即纠正。
7. 本站不保证下载资源的准确性、安全性和完整性, 同时也不承担用户因使用这些下载资源对自己和他人造成任何形式的伤害或损失。
提示  人人文库网所有资源均是用户自行上传分享,仅供网友学习交流,未经上传用户书面授权,请勿作他用。
关于本文
本文标题:新型电动自行车及动力反馈制动系统设计【机+电】【10张图纸】【优秀】
链接地址:https://www.renrendoc.com/p-422413.html

官方联系方式

2:不支持迅雷下载,请使用浏览器下载   
3:不支持QQ浏览器下载,请用其他浏览器   
4:下载后的文档和图纸-无水印   
5:文档经过压缩,下载后原文更清晰   
关于我们 - 网站声明 - 网站地图 - 资源地图 - 友情链接 - 网站客服 - 联系我们

网站客服QQ:2881952447     

copyright@ 2020-2025  renrendoc.com 人人文库版权所有   联系电话:400-852-1180

备案号:蜀ICP备2022000484号-2       经营许可证: 川B2-20220663       公网安备川公网安备: 51019002004831号

本站为文档C2C交易模式,即用户上传的文档直接被用户下载,本站只是中间服务平台,本站所有文档下载所得的收益归上传人(含作者)所有。人人文库网仅提供信息存储空间,仅对用户上传内容的表现方式做保护处理,对上载内容本身不做任何修改或编辑。若文档所含内容侵犯了您的版权或隐私,请立即通知人人文库网,我们立即给予删除!