手机前盖冲压工艺分析及级进模设计.doc

保持架注塑模设计及加工工艺性分析【塑料注射模具含word文档+27张CAD图纸】【侧抽】

收藏

资源目录
跳过导航链接。
ZM085-保持架注塑模设计及加工工艺性分析【塑料注射模具含word文档+27张CAD图纸】【侧抽】.zip
保持架注塑模设计及加工工艺性分析.doc---(点击预览)
任务书.doc---(点击预览)
毕业设计方案论证
毕业设计翻译
侧型芯1A4.dwg
侧型芯2A4.dwg
侧型芯3A4.dwg
侧滑块A1.dwg
凹模板A1.dwg
动模型芯1A4.dwg
动模型芯2A4.dwg
动模型芯3A4.dwg
动模型芯垫板A2.dwg
动模座板A1.dwg
动模拼块A1.dwg
塑件图.dwg
定位圈A4.dwg
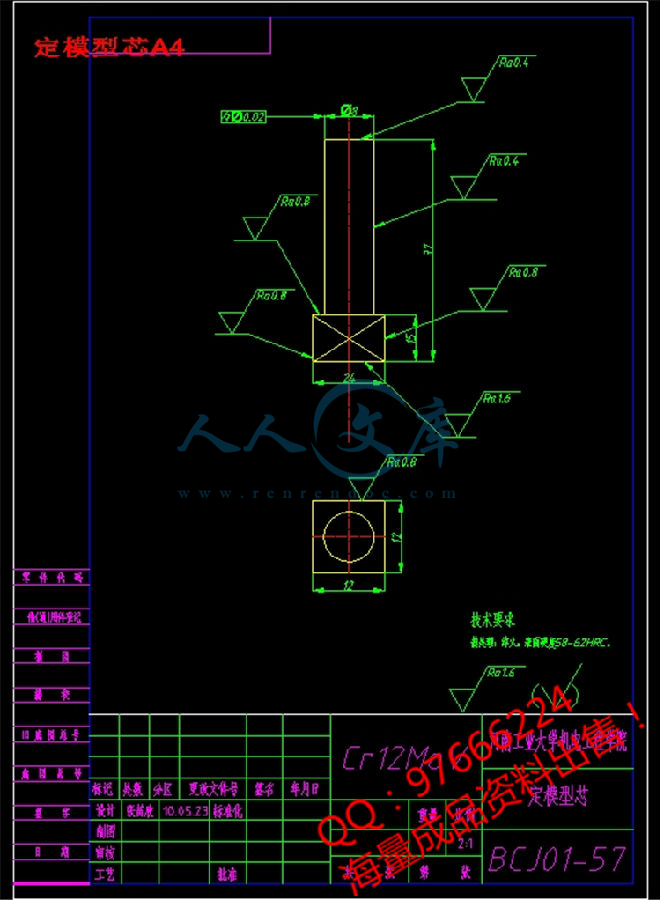
定模型芯A4.dwg
定模型芯垫板A2.dwg
定模座板A1.dwg
定模拼块A1.dwg
定模板A1.dwg
推杆固定板A1.dwg
推板A1.dwg
支撑板A1.dwg
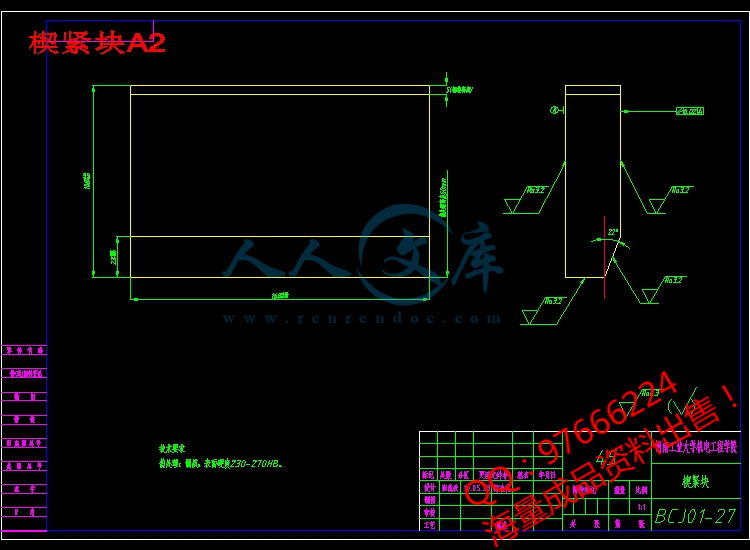
楔紧块A2.dwg
模具总装合模图A0.dwg
模具总装开模图A0.dwg
浇口套A4.dwg
限位挡块A4.dwg
限位片A4.dwg
压缩包内文档预览:(预览前20页/共31页)
预览图 预览图 预览图 预览图 预览图 预览图 预览图 预览图 预览图 预览图 预览图 预览图 预览图 预览图 预览图 预览图 预览图 预览图 预览图 预览图
编号:479801    类型:共享资源    大小:7.38MB    格式:ZIP    上传时间:2015-10-11 上传人:小*** IP属地:福建
45
积分
关 键 词:
保持 维持 注塑 设计 加工 工艺 分析 塑料 注射 模具 word 文档 27 cad 图纸 侧抽
资源描述:

!【详情如下】【注塑塑料模具类】CAD图纸+word设计说明书.doc[19000字,42页]【需要咨询购买全套设计请加QQ97666224】.bat

任务书.doc

设计说明书.doc[19000字,42页]

毕业设计方案论证

毕业设计翻译

侧型芯1A4.dwg

侧型芯2A4.dwg

侧型芯3A4.dwg

侧滑块A1.dwg

凹模板A1.dwg

动模型芯1A4.dwg

动模型芯2A4.dwg

动模型芯3A4.dwg

动模型芯垫板A2.dwg

动模座板A1.dwg

动模拼块A1.dwg

塑件图.dwg

定位圈A4.dwg

定模型芯A4.dwg

定模型芯垫板A2.dwg

定模座板A1.dwg

定模拼块A1.dwg

定模板A1.dwg

推杆固定板A1.dwg

推板A1.dwg

支撑板A1.dwg

楔紧块A2.dwg

模具总装合模图A0.dwg

模具总装开模图A0.dwg

浇口套A4.dwg

限位挡块A4.dwg

限位片A4.dwg

目   次


1  塑料模具的现状1

2  塑件的成形工艺性分析3

2.1  课题题目介绍3

2.2  制件结构形状3

2.3  塑件材料的选择及其结构分析4

2.4  塑件工艺性分析5

2.5   ABS的主要技术指标5

2.6   ABS的注射成型工艺6

3  模具结构形式的拟定6

3.1  确定型腔数量及排列方式6

3.2  模具结构形式的确定7

4  注塑机型号的确定8

4.1  塑件注塑量的计算:8

4.2  注射机型号的确定9

4.3  注射机及型腔数量的校核9

4.4  注射机及参数量的校核10

4.5  模具与注射机安装部份的校核11

4.6  顶出行程校核11

5  分型面位置的确定11

5.1  分型面的形式11

5.2  分型面的设计原则11

5.3  分型面的确定12

6  浇注系统的形式和浇口的设计12

6.1  浇注系统设计原则12

6.2  主流道的设计13

6.3  分流道的设计14

6.4  冷料井的设计16

6.5  浇口的设计17

6.6  浇注系统的平衡19

6.7  排气系统的设计19

7  成型零件的设计20

7.1  成型零件的结构形式成型零件的选材21

7.2  成型零件的计算21

7.3  成型零件钢材的选用23

7.4  成型零件强度及支撑板厚度的计算25

8  模架的确定和标准件的选用26

8.1  定模座板27

8.2  定模板27

8.3  动模座板27

8.4  动模板27

8.5  支承板27

8.6  垫块27

8.7  推杆固定板28

8.8  推板28

9  导向机构的设计28

9.1  导向机构的作用28

9.2  导向结构的总体设计28

9.3  导柱的设计29

9.4  导套的设计29

10  侧向抽芯机构设计30

10.1  结构形式的确定30

10.2  斜导柱侧向抽芯力的计算30

10.3  斜导柱的设计31

10.4  滑块、倒滑槽及定位装置的设计31

10.5  楔紧块的设计32

11  脱模推出机构的设计33

11.1  推杆推出机构33

11.2  推出机构的导向和复位33

12  排气系统确定335

毕业设计总结37

致  谢39

参考文献40

参考文献


[1]冯晓曾等. 模具材料与热处理. 机械工业出版社,1985

[2]《模具制造手册》编写组. 模具制造手册. 北京:机械工业出版社,2000

[3]罗继相. 浅析我国模具行业现状及发展趋势和对策.模具技术,No.3,2001

[4]张容清. 模具设计与制造. 北京:高等教育出版社,2003.8.

[5]刘品,李哲.互换性与测量技术基础.哈尔滨工业大学出版社,2006

[6]吴生绪.塑料成形模具设计手册.北京:机械工业出版社,2008,1.

[7]杨占尧.塑料模具标准件及设计应用手册.北京:化学工业出版社,2008.

[8]屈华昌.塑料成型工艺与模具设计.北京:高等教育出版社,2008.

[9]吴宗泽,罗圣国.机械设计课程设计手册. 北京:高等教育出版社,2006

[10]孙凤勤.模具制造工艺与设备. 北京:机械工业出版社,2008.

[11]翟秀云.塑料自动成型用模具问题的探讨[J].攀枝花学院学报,2002.

[12]陈万林.实用注塑模具手册[M].机械工业出版社,2000-10.

[13]付丽.螺纹自动脱模的注塑模设计[M].轻工机械,2000.第1期.

[14]申开智,叶淑静.塑料成型模具[M].轻工业出版社,1982.

[15] 崔洪斌,杨海如 等编.AutoCAD2009机械图形设计.清华大学出版社.2008,8.

[16] 詹友刚 编著.Pro/ENGINEER中文野火版2.0基础教程.清华大学出版社.2007,2.

[17] 和庆娣,袁巍,刘昌丽 等编著.Pro/ENGINEER Wildfire 3.0中文版模具设计. 机械工业出版社.2007,1.

[18] 杨占尧 主编.塑料模具标准件及设计应用手册.化学工业出版社.2008,3.

[19] 吴生绪 主编.塑料成型模具设计手册.机械工业出版社。2008,3.


内容简介:
机电工程学院 毕业设计外文资料翻译 设计题目 :手机前盖冲压工艺分析及级进模设计 译文 题目 : 注塑模具 学生姓名: 于海鹏 学 号: 20074480304 专业班级: 材控 0703 指导教师: 董毅峰 正文: 外文资料翻译译文 附件: 外文原文 指导教师评语: 签名: 年 月 日 nts正文:外文资料翻译译文 多尺度模拟复合材料和结构与 DIGIMAT ANSYS 文件版本 1.0,2009 年 2 月 ,e-Xstream工程 ,2009 年版权 infoe-X www.e-X 材料 : 工程塑 料、 增强塑料 e-Xstream 技术 : DIGIMAT,Digimat-MF Digimat-FE,DIGIMAT、 ANSYS,分析数据映射图 。 Moldflow、 Moldex3D CAE 技术 。 分析软件: ANSYS。 行业: 材料供应商、汽车、航空、消费者和工业产品。 法律通告 : eXdigimat 和 e-Xstream 工程 是 e-Xstream 工程的注册商标。 其他产品及公司名称和商标的商标 权 或注册商标 权归 他们的各自的主人 所有 。 概要 在这篇文章中 , 简要的 介绍两个尺度的建模方法 ,平均场均化处理和有限元同化 方法, 在进行建模时,这些强大的技术用与微观和宏观的应力和应变场 ,可以通过影响 (改变 )材料内部 微观组织来控制材料在宏观上表现出来的 性能 (例如:纤维取向、纤维含量、纤维长度,等等 ) 。 说明这些技巧 , 我们 目前的状况是:(一) 应用有限元分析均到纳米二氧化钛 ; (二 )研究了注入玻璃纤维增强塑料霓虹灯扣使用有限元计算的宏观尺度结合 中值场 均在微 观的 尺度 上 。 多尺度建模:简介 作为一种激励 人心的例子 , 让我们来看一个由短玻璃纤维加固的热塑性聚合物塑料部件。 作为典型的注塑生产过程,这种分布于成品内部的纤维将毫无疑问的会在走向和长 度上发生普遍的改变。 看图( 1), 该复合材料 同时呈现各向异性与非均质性, 这使它极难得到一个可靠准确的产品模拟,因为所利用经典的方法是基于宏观的本构模型。 然而,通过多尺度的方法使预测模拟成为可能 ,这种预测模拟可以把这种复合材料用相当简单的方式进行描述,如图: nts 图( 1) : 在注射玻璃纤维增强塑料后的离合器踏板中的纤维取向分布图 (有罗地亚公司和特瑞 堡 集团提供) 此图 让我们研究学习了异构实体的显微组织组成的矩阵资料并且这些所谓的“夹杂物”可以是短纤维、小片晶体、颗粒、微小孔或微裂纹。 我们的目标是根据它的显微结构,模 拟预测产品在施加载荷和增加边界条件 ( BCs) 下所产生的变化和影响。 我们能区分出两种尺度 ,分别是微观层次和宏观层次。 这个模型在微观结构尺度上与异质性质相符 ,然而从宏观尺度上看,可以认为是局部均匀的。如图: 图( 2) :在实践中 ,解决力学问题时的计算不可能停留在微尺度层面上。因此 ,我们考虑的是宏观尺度 , 并且假设每个质点是大量代表性 的等效体积单元 (RVE)的中心 ,这些质点包含潜在的异质性的微观结构。 经典的固体力学是进行宏观尺度分析的 ,只可惜在计算每个点后,应力、应变值像 边界条件 传送到潜伏的 等效nts体积单元 一样被传送 了。 换句话说 :每个数值的缩放就被认为是一个宏观点。这样等效 体积 单元的问题都解决了滨且每个单元都返回应力和刚度的测试值 ,这个方法被用于宏观尺度的计算中。 图 2:多尺度的材料建模的插图,现在唯一的困难在于 这种用二尺度的方法(和更多一般的多尺度的方法)来解决等效体积单元的问题。它可以被等价为一个在经典边界条件作用下的等效体积单元 ,此时宏观上的应变与应力等于所有等效体积单元内部未知的区域内微应变和应力的体积平均值。 在线弹性的条件下 ,运用复合材料的宏观尺度时,涉及到了那两个能给出有效刚度或总体刚度的均值。为了解决这个 问题 ,你可以使用等效体积单元有名的有限元方法算法 ,见图 7到 10。该方法的优点是既简单又非常准确。然而 ,它有两个主要的缺点是 :在计算实际的微结构时网格化分非常困难和在处理非线性问题时占用大量的 CPU 运算时间 ,比如在模拟计算非弹性材料性能的时候。 另一个完全不同的方法是平均场均质法 ,这种方法是基于应力体积平均值和一个等效体积单元的每个相的应变场之间的假设关系而形成的方法 ;见图 3。 与绝对的有限元方法和其他所有现存的数值转换方法相比 ,平均场均质法( MFH)不仅是最好用的而且在占用 CPU 时间方面明显是最快的。然而 ,平均 场均质法 也有两个缺点 ,一是它无法给出每个相中的详细应变和应力场数值 ,二是局限于夹杂物的椭球面形状。 nts图 3:平均场均质法的过程。 (1)局部应变根据宏观应变计算; (2)局部应力根据局部应变和每个相的组织模型来计算; (3)宏观应力根据平均局部应力计算。 一个典型的等效体积单元的例子是 Mori-Tanaka 模型,已经成功适用于具有相同和对齐尺寸的椭圆形夹杂物的两相复合材料中。该模型假定了,如果等效体积单元是单独存在于一个无限的由实际的基体材料组成的空间中时,每个夹杂物都包含了等效体积单元。边界条件在解决单一的夹 杂问题时相当于实际的等效体积单元的基体相应变场体积平均值的计算方法。 单夹杂物分析问题已经被 J.D. Eshelby 在一篇标志性论文中解决了,这是平均场均质模型划时代的基石。 图四:原理的 Mori-Tanaka 同质化的程序 Mori-Tanaka 模型和其它 平 均场均质模型已经推广到 许多 案例中了 ,如热耦合、两相非直线纤维的复合材料(使用多步骤分步处理的途径)或多相复合材料(使用一个多层次的方法) 。 这个预测已经直接广泛地验证了均场均质模型的有限元模拟和实验结果的校验。 作为一种普遍的结论 ,人们发现在线 (热 )弹性条件下 ,平均场均质可给出有效特性的精确预测值 ,尽管是分布式取向 ,然而在终止近似值法上取得的进步仍然是受欢迎的。 另外 ,确定平均场均质模型可用于 UD,并可用在复合材料每个微结构中像用在机织织物的每根纱线中一样。 一个重要并且仍持续在理论模型和计算方法上努力的在材料或几何非线性领域推广。这种扩展包括一些主要的困难:第一个是线性化 ,在微观尺度上本构方程需要线性化 ,需要微线弹性 -或像热弹性一样的格式。第二个问题是对所谓的对比资料,即定义每个相中具有均匀瞬时刚度的控制运算符。接下来需要解决的问题是一阶和二阶同nts化,在一 阶均以真正的本构模型计算作为比较材料 ,但不是每个相的应变和应力场的体积平均值。在一个二阶配方 ,充足的统计信息 ,即每个相的应变和应力场的方差也考要虑进去。 最后 ,非常难的技术难点涉及 Eshelby 和希尔的与各向异性的瞬时刚度相关算子比较的张量计算方法。 在多尺度分析耦合有限元方法用于宏观尺度 ,同时 ,确定各高斯点进行了计算 ,无论是在线性或非线性的状态。 这是实践中最可行的方法。见图 5。 图 5: 经典的铁和耦合的有限元 / Digimat-MF 方法对比。 广泛的验证和验证结果表明 ,平均场均质模型确定可用于实践中存在的非线性问题 ,并且一般情况下可以带来良好的非线性预测值 ,然而在某些情况下工作可以持续提高精度 (和减少 CPU 时间与多尺度分析相结合)。 有限元均值处理法 : 一种纳米复合材料的应用方法 未来材料最有可能的是纳米材料 ,它广泛的为未来各种领域提供新的划时代的应用 ,例如如纳米电子学 ,纳米生物科技和纳米医学等领域。 这样 ,越来越多的精力放在理解和模拟他们的性状上以及得知什么是纳米效应。而目前正在开发的新工具 ,来解决这个工程上的挑战 ,今天有些新工具已经提供给工程师使用。其中 :nts有限元素均值法应用的最多。 模型聚合物类填料 ,一种典型的 纳米效果填料。材料科学家在纳米尺度上,面临一些有关设计和加工的纳米复合尺度的挑战 ,这些新的物理现象 ,从宏观尺度上看是可以忽略不计的。举例来说, 纳米填料均匀的分散在复合基体中,被认为可以改善材料的机械性能 ,然而期望具有导电率的聚和物类和渗透类导热或导电性都需要增加的基础材料。 参见图 6,实现完成一个或其他如今是在材料加工和对其研究方面构成的挑战。 图六 : 纳米填料的扩散 有限元均值法:它需要进行几何研究并被明确的产生并且是网状的 ,可以准确模拟渗流和集群效应。如图所示 ,介绍了宏观材料质点的弹性力学性能目前在塑料 聚合物上的影响。 图 7 给出了两种周期性纳米结构 ,也称为等效体积元素 (RVE),这已经在使用 Digimat-FE 方法。 介绍了聚合类材料参数已经产生最终的几何坐标,聚合材料内含物集中的聚类附近的两个截然不同的地方。体积分数 5%的相位和夹杂物是球形的。 一旦包围 ,这些结构将在等效体积单元中只受单向拉伸条件 ,运用 x, y,z 轴的负向和有限元方法。利用 ANSYS 有限元求解器进行求解之后问题就解决了。 nts 图 7:微结构与均匀分布夹杂物 (左 )与群集 (右 )。 结果比较 : 图 8: 应力分布在夹杂物 (左 )和矩阵 (右 )为随机放置 的杂质 图 8 到 10 个说明应力分布矩阵和夹杂物的阶段 ,在这个案例中介绍的是 x 轴单向拉伸试验测试。由于最近的聚类中心附近的包裹 ,应力集中现象出现。这样 ,可以提高了 30%的拉应力进行了观察 ,对聚类情况 x 轴向单向拉伸加载条件下进行观察 ,见图 10。 图 11 是在等效体积单元中 S33 的应力与应变分布和 E33 的应变分布和基质材料的相。 观察夹杂的相时候应用了一个明显的更高的应力水平。这种更高的应力集中 ,不会随机或均匀分布内含的夹杂物 ,而且在施加载荷的时候可能会导致脱粘。 nts图 9:S11 应力分布在夹杂物 (左 )和矩阵 (右 )为聚物 。 图 10: 2D 等效体积单元的部分观点的群集 (左 )和随机 (右 )。拉应力分布。 图 11:S33(左 )和 E33 应力应变 (右 )分布在等效体积单元的纳米阶段 ,对这两种情况下 ,一个沿 z 轴方向的加载。 nts在这个低体积分数的内含物中 ,我们看到这类不明显改变其宏观力学性能的资料 ,请参阅表 1。 处在这样一个位置 ,最好的方法是避免纳米夹杂物材料的出现,当试图增加基材的刚度 (基质刚度 = 2195 MPa)结合纳米填料 (填料刚度 = 7000 MPa)。 有限元法和平均场均值处理法耦合计算 : 已经应用到一部分的工业中 。 出于许多原 因 (制造成本、适应性、加工方法、高强度对抗 .亮度比等。 ) 注射部分由短的玻璃纤维增强塑料在我们的日常生活中已经无处不在。 但当它用这样的材料做成的模型 ,能够模拟宏观模型构成的物质模型受到捕捉效应的影响,例如注射过程?答案是否定的 ,因为他们并没有从中捕获的由注塑工艺决定的对纤维的分布方向产生的影响。 下面的例子中 ,它由一个霓虹灯扣受载荷的过程 ,介绍了耦合分析和有限元软件 ANSYS,DIGIMAT-MF Moldex3D 之间的区别。这个过程在图 12 中表现的很清楚 ,并且包括下列步骤: 1、注射成型工艺过程使用 Moldex3D 进行了数值模拟。现有结果是纤维取向张量 ,将作为输入 DIGIMAT 结构仿真。 2、张量计算的定位可用映射图在准备从注射网格映射到粗糙的结构性冲突的映射工具 (在 DIGIMAT 中 )。 3、 这个结构仿真是利用 ANSYS 有限元求解加上 Digimat-MF、多尺度的材料建模 ,模具制作的每个整合平均场均值方法进行结构模型。 图 12:耦合分析的过程。 ntsDIGIMAT 以获得 Moldex3D 纤维取向张量作为输入 ,除了材料性能之外还有作为塑料模型采用了 ANSYS 有限元模拟。 问题的说明: 这个轻环由四个独立 的部分组成 ,见图 13,也显示了不同的零件之间的接触结果。 他们两个都由 30%的玻璃纤维增强尼龙和 Bergamid(一种新型复合材料)注入。他们的注射过程都在 Moldex3D 中进行了注塑模拟。 滑块和支座组建假设是由钢铁制作的。 关闭的卡环是模拟位移滑而挡住了支持和部分的内部。对称性边界条件来限制也被应用到一半的部分研究。这个目标是为了评价模拟零件表面的平均应力最大值 ,在负载期间 ,比较了利用线性弹性响应模型 ,利用材料的弹性模量进行确定 DIGIMAT-MF 尼龙与玻璃纤维和弹塑性模型进行平均场均值法计算的 结果。 材料建模 为 了 模仿 在 DIGIMAT-MF 中的PAGF 模型 ,做了以下假设 : 1、 玻璃纤维仍旧在线性弹性的领域。 2、 聚酰胺(尼龙)具有可塑性和线弹性。 3、 纤维的纵横(长度 /直径)比值为30。 参见图 14:拉伸反应的材料模型。 nts图 13:表述的是霓虹灯扣和四个独立部件之间触体的关系。由 Trilux 和 CADFEM股份有限公司提供。 图 14: Bergamid 尼龙材料的模型。各向同性案例的拉伸响应 ,固定的纤维取向 (1D)、随机二维定位 (2D)和随机三维定位 (3D)。由 Trilux 和 CADFEM 股份有限公司提供。 nts仿 真结果 而有限元均值法具有明显的在等效体积单元中准确的应变 /应力场优势,平均场均值法只能得到微观层面的平均的应力与应变值。 尽管如此 ,它给我们的信息如果我们用宏观的本构模型我们将不能使用这个方法。 同样地 ,在这个基质的相中平均累积塑性应变的可以直接的在塑料部件中去观察可塑性的分布。 最大的塑性变形都可以从外围表面部分观察到。如图 15。 图 15:平均分布于塑性应变积累在基体相的内部和外部的部分。范围 0.01%(蓝色 )0.09%(红色 )。由 Trilux 和 CADFEM 股份有限公司提供。 图 16:线性弹性各向同性反应 (经典的有限元法 )与各向异性非线性 (有限元法和平均场均值法 )的对比。 提高到 21%的不同是观察应力大小 ,用硬线弹性模型得到更高的应力。 图 16:S11压力分布 (MPa)的各向同性弹性钩 (左 )和各向异性非线性模型 (右 )。由 Trilux和 CADFEM 股份有限公司提供。 nts参考书目: 1. Nemat-Nasser.S, Hori, M. Micromechanics: 异构体的整体性能 艾斯维尔科学出版社, 1993。 2. 莫里,田中具有弹性能量杂质的材料的基质的平均应力金属学报, 1973年 ,571-574,第 21 卷。 3. 弹性 模量的确定的领域中的相关问题 Eschelby 博士, 1226 年,伦敦 :伦敦皇家学会 1957 年 ,第 241 卷, 376-396。 4. 概述聚合物基纳米复合材料的工程应用前景 Chmutin第一卷。 5. 有纳米压痕的纳米硅基的纳米复合材料聚合物概要郭等人强化塑料和复合材料杂志, 2004 年。 nts附件:外文原文 Multi-Scale Modeling of Composite Materials and Structures with DIGIMAT to ANSYS Document Version 1.0, February 2009 Copyright, e-Xstream engineering, 2009 infoe-X www.e-X Materials: Engineering Plastics, Reinforced Plastics. e-Xstream Technology: DIGIMAT, Digimat-MF, Digimat-FE, Digimat to ANSYS, MAP. Complementary CAE Technology: Moldflow, Moldex3D, SigmaSoft, ANSYS. Industry: Material Suppliers, Automotive, Aerospace, Consumer & Industrial Products. Legal Notice. eX, eXdigimat and e-Xstream engineering are registered trademarks of e-Xstream engineering SA. The other product and company names and logos are trademarks or registered trademarks of their respective owners. EXECUTIVE SUMMARY In this paper, we briefly introduce two multi-scale modeling approaches, namely the Mean-Field (MFH) and Finite Element Homogenization (FEH) methods. These powerful techniques relate the microscopic and macroscopic stress and strain fields when modeling material behaviors and hence can capture the influence of the material microstructure (i.e. fiber orientation, fiber content, fiber length, etc.) on its macroscopic response. To illustrate these techniques, we also present (i) an application of finite element homogenization to a nanostructure and (ii) the study of an injected glass fiber reinforced plastic neon light clasp using finite element computations at the macro scale coupled with MF homogenization at the micro scale. Material Multi-Scale Modeling: an introduction ntsAs a motivating example, let us consider a plastic part made up of a thermoplastic polymer reinforced with short glass fibers. As typical of the injection molding manufacturing process, the fiber distribution inside the final product will vary widely in terms of orientation and length, see Figure 1. The composite material will be both anisotropic and heterogeneous, which makes it extremely difficult to perform a reliable simulation of the product using a classical approach based on macroscopic constitutive models. However, a predictive simulation is possible via a multi-scale approach, which can be described in a rather general setting as follows. Figure 1: Fiber orientation distribution in an injected glass fiber-reinforced plastic clutch pedal. Courtesy of Rhodia & Trelleborg. Let us study a heterogeneous solid body whose microstructure consists of a matrix material and multiple phases of so-called “ inclusions” , which can be short fibers, platelets, particles, micro-cavities or micro-cracks. Our objective is to predict the response of the body under given loads and boundary conditions (BCs), based on its microstructure. We can distinguish two scales, the microscopic and macroscopic levels, respectively. The former corresponds to the scale of the heterogeneities, ntswhile at the macro scale, the solid can be seen as locally homogeneous; Figure 2. In practice, it would be computationally impossible to solve the mechanical problem at the fine micro scale. Therefore, we consider the macro scale and assume that each material point is the center of a representative volume element (RVE), which contains the underlying heterogeneous microstructure. Classical solid mechanics analysis is carried out at the macro scale, except that at each computation point, strain or stress values are transmitted as BCs to the underlying RVE. In other words, a numerical zoom is realized at each macro point. The RVE problems are solved and each of them returns stress and stiffness values, which are used at the macro scale. Figure 2: Illustration of the multi-scale material modeling approach, after Nemat-Nasser and Hori (1). Now the only difficulty in this two-scales (and more generally multi-scale) approach is to solve the RVE problems. It can be shown that for a RVE under classical BCs, the macro strains and stresses are equal to the volume averages over the RVE of the unknown micro strain and stress fields inside the RVE. In linear elasticity, relating those two mean values gives the effective or overall stiffness of the composite at the macro scale. In order to solve the RVE ntsproblem, one can use the well-known finite element (FE) method, see Figures 7 to 10. This method offers the advantages of being very general and extremely accurate. However, it has two major drawbacks which are: serious meshing difficulties for realistic microstructures and a large CPU time for nonlinear problems, such as for inelastic material behaviour. Another completely different method is mean-field homogenization (MFH), which is based on assumed relations between volume averages of stress or strain fields in each phase of a RVE; see Figure 3. Compared to the direct FE method, and actually to all other existing scale transition methods, MFH is both the easiest to use and the fastest in terms of CPU time. However, two shortcomings of MFH are that it is unable to give detailed strain and stress fields in each phase and it is restricted to ellipsoidal inclusion shapes. Figure 3: Mean-field homogenization process: (i) local strains are computed based on the macro strains, (ii) local stresses are computed based on the local strains and according to each phase constitutive model, and (iii) macro stresses are computed by averaging the local stresses. nts A typical example of MFH is the Mori-Tanaka model (2) which is successfully applicable to two-phase composites with identical and aligned ellipsoidal inclusions. The model assumes that each inclusion of the RVE behaves as if it were alone in an infinite body made of the real matrix material. The BCs in the single inclusion problem correspond to the volume average of the strain field in the matrix phase of the real RVE. The single inclusion problem was solved analytically by J.D. Eshelby (3) in a landmark paper, which is the cornerstone of MFH models. Figure 4: Schematic of the Mori-Tanaka homogenization procedure. Mori-Tanaka and other MFH models were generalized to other cases, such as thermoelastic coupling, two-phase composites with misaligned fibers (using a multi-step approach) or multi-phase composites (using a multi-level method). The predictions have been extensively verified against direct FE simulation of RVEs or validated against experimental results. As a general conclusion, it was found that in linear (thermo)elasticity, MFH can give extremely accurate predictions of effective properties, although for distributed orientations, progress in closure approximation will be welcomed. Note also that MFH can be used for UD, and for each yarn in woven composites. An important and still ntsongoing effort both in theoretical modeling and in computational methods is the generalization of MFH to the material or geometric nonlinear realms. Such extension involves some major difficulties. The first one is linearization, where constitutive equations at microscale need to be linearized onto linear elastic- or thermoelastic-like format. The second issue is the definition of so-called comparison materials which are fictitious materials designed to possess uniform instantaneous stiffness operators in each phase. The next problem to be solved is first-order vs second-order homogenization. In first-order homogenization comparison materials are computed with real constitutive models but volume averages of strain or stress fields per phase. In a second-order formulation, richer statistical information, namely the variance of strain or stress fields per phase is also taken into account. Finally, a very technical difficulty concerns the computation of Eshelby s or Hill s tensors and is related to the anisotropy of the comparison instantaneous stiffness operator. Within a coupled multi-scale analysis, FE method is used at macro scale, while at each Gauss integration point, MFH computation is carried out, either in the linear or nonlinear regime. This is the most feasible approach in practice. See Figure 5. RVE homogenization Each inclusion nts Figure 5: Comparison between the classical FE and the coupled FE/Digimat-MF approaches. Extensive verification and validation results show that MFH can be used in practice for nonlinear problems and leads to good predictions in general, while work continues on improving accuracy in some situations (and reducing CPU time for coupled multi-scale analysis). FE Homogenization: an application to nanocomposites Most likely will nanomaterials be the materials of tomorrow, as they offer new horizons of applications in a wide variety of fields, e.g. nanoelectronics, bio-nanotechnology and nanomedicine. As such, more and more effort is put in understanding and modeling their behavior as well as acquiring know-how about nanoeffects. While new tools are being developed to tackle this engineering challenge, some are already available to the engineer of today. Among them: Finite Element Homogenization (FEH). ntsModeling Filler Clustering, a typical nanoeffect Material scientists face several challenges related to the design and the processing of nanocomposites as, at the nano scale, new physics and phenomena that are negligible at the macro scale enter the picture. For instance, uniform dispersion of the nanofiller inside the composite matrix is sought to improve the material mechanical properties, while clustering and percolation are desired when the conductivity of a base material, thermal or electrical, needs to be increased; see Figure 6. Achieving one or the other nowadays constitutes a challenge in terms of both material processing and study. Figure 6: Nanofiller dispersion. FEH, as it requires the studied geometry to be explicitly generated and meshed, allows an accurate modeling of percolation and clustering effects. As an illustration, we present the effect of clustering on the elastic mechanical properties of a macroscopic material point. Figure 7 presents two periodic nanostructures, also referred to as Representative Volume Element (RVE), that have been generated using Digimat-FE. Clustering parameters have been introduced to generate the rightmost geometry, whose inclusions are concentrated around 2 distinct clustering points. Volume fraction of the inclusion phase is 5% and the ntsinclusions are spherical. Once meshed, these geometries will be subjected to uniaxial tensile conditions in the RVE x-, y- and z-directions and the finite element problem will be solved using the ANSYS finite element solver Figure 7: Microstructures with uniformly distributed inclusions (left) and clustered inclusions (right). Result-ComparisonFigure 8: S11 stress distribution in the inclusions (left) and in the matrix (right) for randomly placed inclusions Figure 8 to 10 illustrate the stress distribution in the matrix and inclusion phases, in the case of the x-axis uniaxial tensile test. Due ntsto the proximity of the inclusions around the clustering centers, stress concentrations appear. As such, up to 30% higher tensile stresses are observed for the clustered case, under x-direction uniaxial tensile loading conditions, see Figure 10. Figure 11 plots the S33 stress and E33 strain distribution in the inclusion and matrix phases, as well as in the RVE. One clearly observes the higher stress levels in the inclusion phase. Such higher stress concentrations, that are not observed for randomly or uniformly placed inclusions, could lead to debonding during loading. Figure 9: S11 stress distribution in the inclusions (left) and in the matrix (right) for clustered inclusions. Figure 10: 2D section vi
温馨提示:
1: 本站所有资源如无特殊说明,都需要本地电脑安装OFFICE2007和PDF阅读器。图纸软件为CAD,CAXA,PROE,UG,SolidWorks等.压缩文件请下载最新的WinRAR软件解压。
2: 本站的文档不包含任何第三方提供的附件图纸等,如果需要附件,请联系上传者。文件的所有权益归上传用户所有。
3.本站RAR压缩包中若带图纸,网页内容里面会有图纸预览,若没有图纸预览就没有图纸。
4. 未经权益所有人同意不得将文件中的内容挪作商业或盈利用途。
5. 人人文库网仅提供信息存储空间,仅对用户上传内容的表现方式做保护处理,对用户上传分享的文档内容本身不做任何修改或编辑,并不能对任何下载内容负责。
6. 下载文件中如有侵权或不适当内容,请与我们联系,我们立即纠正。
7. 本站不保证下载资源的准确性、安全性和完整性, 同时也不承担用户因使用这些下载资源对自己和他人造成任何形式的伤害或损失。
提示  人人文库网所有资源均是用户自行上传分享,仅供网友学习交流,未经上传用户书面授权,请勿作他用。
关于本文
本文标题:保持架注塑模设计及加工工艺性分析【塑料注射模具含word文档+27张CAD图纸】【侧抽】
链接地址:https://www.renrendoc.com/p-479801.html

官方联系方式

2:不支持迅雷下载,请使用浏览器下载   
3:不支持QQ浏览器下载,请用其他浏览器   
4:下载后的文档和图纸-无水印   
5:文档经过压缩,下载后原文更清晰   
关于我们 - 网站声明 - 网站地图 - 资源地图 - 友情链接 - 网站客服 - 联系我们

网站客服QQ:2881952447     

copyright@ 2020-2025  renrendoc.com 人人文库版权所有   联系电话:400-852-1180

备案号:蜀ICP备2022000484号-2       经营许可证: 川B2-20220663       公网安备川公网安备: 51019002004831号

本站为文档C2C交易模式,即用户上传的文档直接被用户下载,本站只是中间服务平台,本站所有文档下载所得的收益归上传人(含作者)所有。人人文库网仅提供信息存储空间,仅对用户上传内容的表现方式做保护处理,对上载内容本身不做任何修改或编辑。若文档所含内容侵犯了您的版权或隐私,请立即通知人人文库网,我们立即给予删除!