汽车后悬置支撑座冲压模设计【全套含CAD图纸、说明书】
收藏
资源目录

压缩包内文档预览:
编号:14542364
类型:共享资源
大小:3.55MB
格式:ZIP
上传时间:2019-02-11
上传人:机****料
认证信息
个人认证
高**(实名认证)
河南
IP属地:河南
30
积分
- 关 键 词:
-
全套含CAD图纸、说明书
汽车
悬置
支撑
支持
冲压
设计
全套
cad
图纸
说明书
仿单
- 资源描述:
-


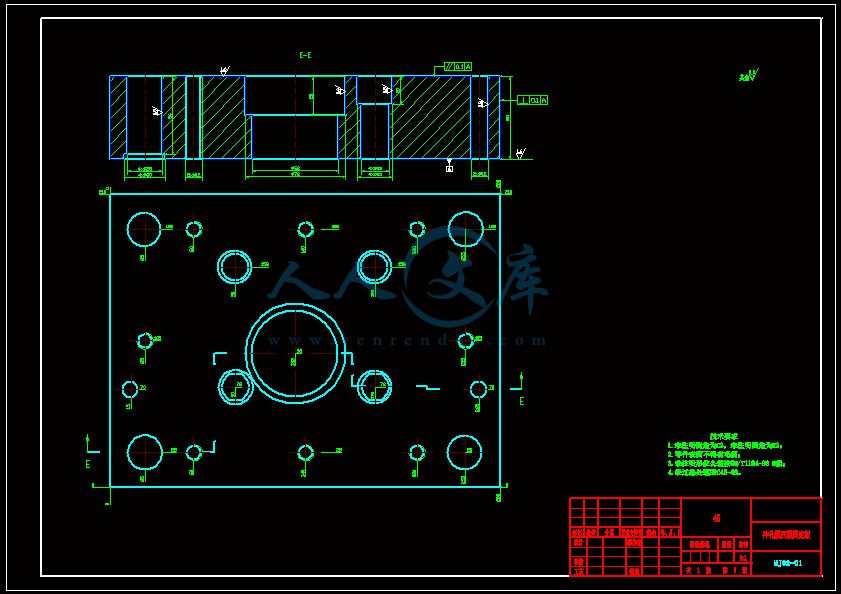

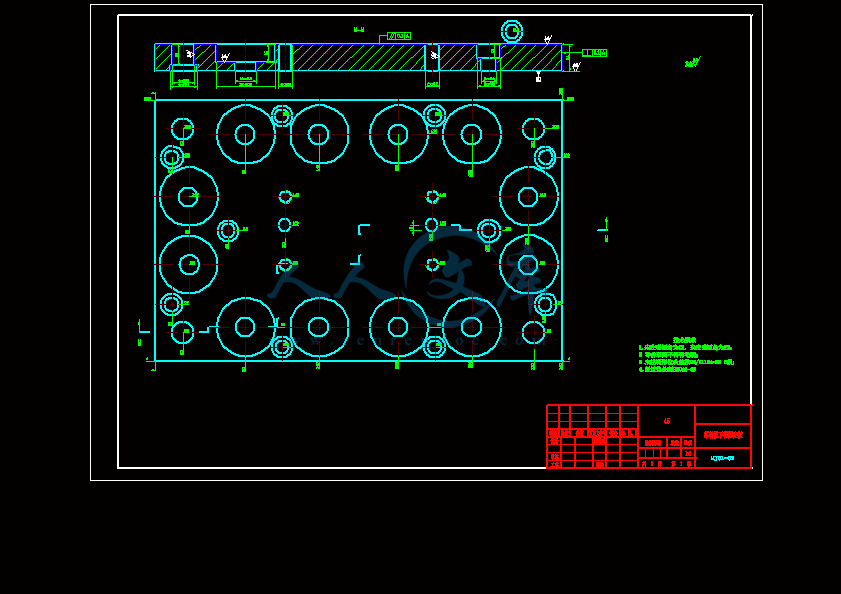
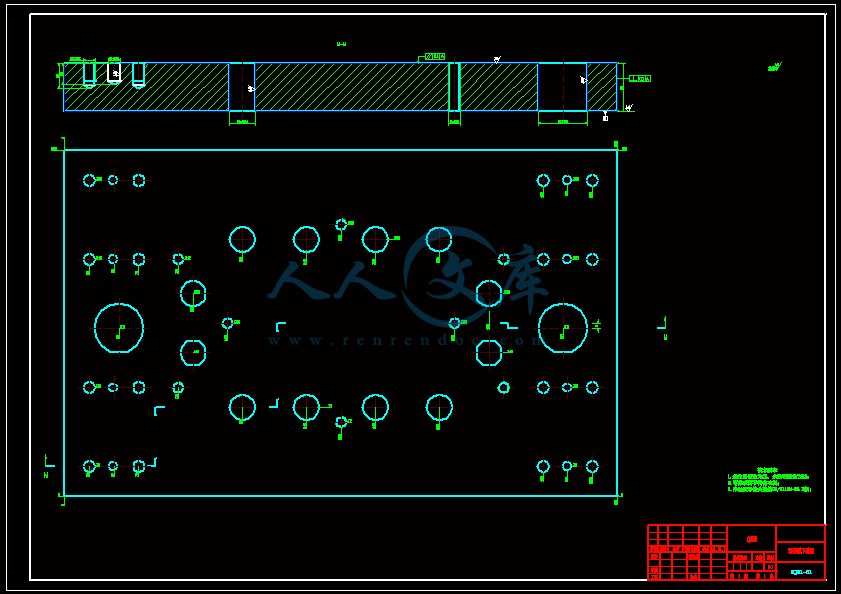

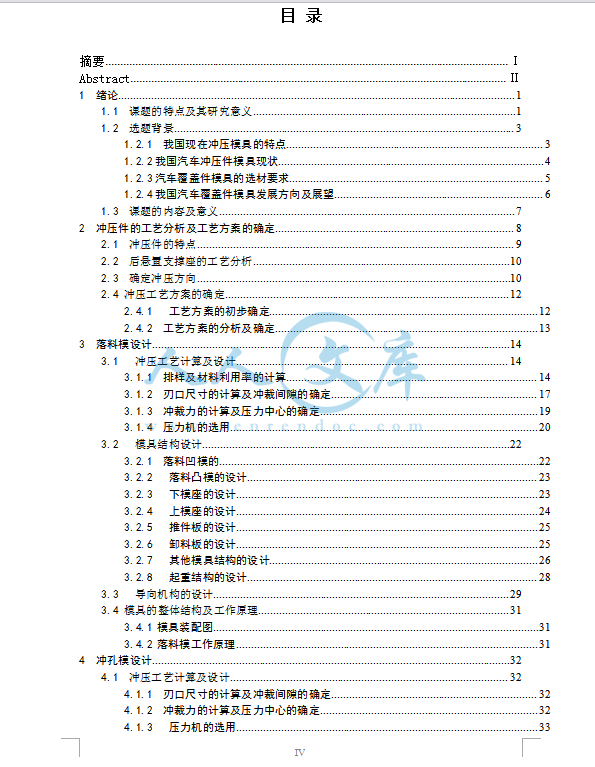

- 内容简介:
-
毕业设计(论文)任务书课题名称 汽车后悬置支撑座冲压模 学 院专 业 班 级 学 号 姓 名指导教师(签字) 教研室主任(签字) 院 长(签字) 年4月14日一、课题的主要内容和基本要求(一)课题的主要内容1.查阅相关的汽车覆盖件模具的设计规范和设计要求了解汽车覆盖件模具的基本工作原理和结构。2.分析汽车后悬置支撑座的冲裁工艺过程,设计该零件的落料冲孔成型模;3.使用UG对制件进行工艺补;4.确定制件的工艺方案;5.说明设计原理、依据及主要计算过程;6.查相关资料设计上模座、下模座以及压料圈;7.设计模具辅助零件;8.按给定的要求在UG平台上完成模具的零件、装配以及工程图的设计。(二)课题的基本要求1.用UG、AutoCAD软件建立三维模具图以及若干张二维零件图,图纸量折合成A0号图纸不小于4张。2.设计说明书要求不少于两万字。3.查阅与课题相关的文献16篇以上。4.翻译与课题或专业相关外文资料,译文字数不少于3000字。5.提交相关毕业设计资料(设计图、说明书、翻译资料等)。二、进度计划与应完成的工作(一)进度计划1.查找相关外文资料,并翻译一篇外文资料;2.收集汽车覆盖件的模具图片(15张以上),收集汽车覆盖件模具的相关的设计规范和企业标准。3.拿到课题,查找关于汽车覆盖件模具设计的相关资料,为设计做准备;4.写开题报告;5.复习UG三维设计软件、CAD制图软件等软件的操作,为建立三维立体模型打好基础;6.进行模具的三维立体模型设计;7.绘制模具的图纸及编写设计说明书;8.CAD出图及资料的整理;9.答辩。(二)应完成的工作1. 查阅相关模具设计资料;2. 翻译一篇与机械相关的外文资料,字数不少于3000字(附外文原文);3. 完成模具的三维实体模型;4. 绘制不少于3.5张A0图纸(模具的装配图及主要零件图);5. 编写模具设计说明书,其中包括400字左右的中文摘要,英文摘要应与中文摘要内容完全相同。3Soil and Tillage ResearchVolume 171, August 2017, Pages 18A power estimator for an integrated active-passive tillage machine using the laws of classical mechanics Iman AhmadiShow more/10.1016/j.still.2017.04.006Get rights and contentHighlightsA model was developed to estimate power needs of an integrated tillage machine.This model was designed by modification of the two previously developed models.The formulas were entered into an Excel file to simplify required calculations.Most of the results were reasonable regarding to the machine required power.AbstractThe integration of an active and a passive tillage tool results in several benefits. In this study, power requirement of an integrated active-passive tillage machine was investigated using a theoretical procedure. To achieve this goal, two of the models developed previously regarding the power needs of a rotary tiller and a subsoiler were modified and combined to result in an integrated estimator for prediction of the power requirements of the combined machine. Verification of the integrated estimator was carried out by comparing the estimator outputs with experimental results obtained by other researchers. According to the results of the study, the error percentage of the estimator in predicting draft force, rotational power, drawbar power, and negative draft of an integrated active-passive tillage machine in comparison with the experimental data of Weise (1993) were 16%, 47%, 6%, and 3%, respectively. Moreover, similar proportions of rotational power to total power as well as similar volumetric energy consumptions were obtained from the estimator developed herein and the experimental study of Chamen et al. (1979). Furthermore, there were promising correlations between estimated torques in this study and the study of Anpat and Raheman (2017), as well as between estimated draft forces and powers in this study and the study ofShinners et al. (1993). Finally, considering the correlations between the data obtained herein and the study of Manian and Kathirvel (2001), the estimator developed in this study predicted the values of draft force, draft power, total power and required torque of the machine fairly well. However, it overestimated the value of draft force, especially when forward speed of the machine was low. To sum up, the majority of the estimator outputs were aligned with the results obtained by other researchers.Keywords Integrated tillage machine; Active and passive implements; PTO and drawbar powers1. IntroductionA single tillage machine can be categorized either as an active machine or as a passive implement. While the required rotational power of an active tillage machine (a driven implement) is obtained through the tractor power take off (PTO) shaft; a passive tillage machine (a drawn implement) requires only drawbar power of tractor to be operated (Srivastava et al., 2006).Consider an active tillage machine having blades that rotate in vertical plane clock-wisely while its power source (i.e. tractor) is moving straight forward to the right. The interaction between the rotating blades and soil makes the soil to be loosened greatly, but at the same time this operation generates negative draft force and the machine tends to reduce its working depth. On the other hand, if a passive tillage machine having blades with an acute rake angle is considered, the interaction between the blades and soil, tends to deepen the working depth of the machine and to increase the implement draft force (McKyes, 1985; Godwin and ODogherty, 2007). Therefore, in order to reduce the draft force requirement of a tillage implement, the idea of combining an active and a passive tillage machine to form an integrated active-passive tillage implement seems promising. Because in this combination the negative draft force of the active implement supplies a portion of the draft force needs of the passive machine and the operation of the passive implement stabilizes the working depth of the active one without adding additional depth stabilizing ballast (Anpat and Raheman, 2017).During the last three decades, researchers have tried to study different aspects of this type of tillage machine. These aspects include the effects of the integrated machine on the properties of the tilled soil and the harvested crop yield (Chamenet al., 1979; Weise, 1993), as well as calculation of power requirements for the operation of the combined implement (Chamenet al., 1979;Shinnerset al., 1993;Weise, 1993;Manian and Kathirvel, 2001; Anpat and Raheman, 2017). Almost all of the studies carried out with the aim of estimating power requirements of the active-passive tillage machine have been followed an experimental procedure. An exception in this regard is the work performed by Russian scientists (Bernacki et al., 1972) who developed a number of theoretical formulas for calculating required power of it.Therefore, in this study a power estimator for an active-passive tillage implement has been developed by modifying and combining the two other theoretical models presented by Ahmadi (Ahmadi, 2016; Ahmadi, 2017). One of the aforementioned theoretical models is developed to calculate the required rotational power of a rotary tiller (an active tillage tool), and the other is created to estimate the drawbar power needs of a winged subsoiler (a passive tillage machine).2. Materials and methods2.1. Essential components of the power estimator developed in this studyThe machine considered as an active-passive tillage implement is composed of a rotary tiller and a subsoiler (Fig. 1); therefore, its power estimator is developed by modifying and combining the power calculators of a rotary tiller (Ahmadi, 2017) and a subsoiler (Ahmadi, 2016).Fig. 1.Schematic diagram of an active-passive tillage machine.Figure optionsEach of the primary power calculators receives the soil, machine, and working state parameters as its inputs and results in the required power of the corresponding machine as an output. The soil parameters include cohesion (c), internal friction angle (), and bulk density (). The machine parameters include rotor radius (R), blade length (BL) and width (BW), number of blades per flange (Nb), number of flanges (Nf), and angle of soil-metal friction () for the rotary tiller; and width of the subsoiler wing (W), width (b) and thickness (t) of the shank (it is supposed that the subsoiler share width is also equal tob, as depicted inFig. 1), number of the shanks (N), surface area of the wing (An), and angle of soil-metal friction () for the winged subsoiler. The working state parameters include forward velocity (v), angular velocity (), and working depth (d) for the rotary tiller; and forward speed (v), soil vertical upheaving (h), disturbed soil overlap percentage of the adjacent shanks (OP), and working depth (h) for the winged subsoiler. To automate performing necessary calculations, all of the mathematical formulas were entered into an Excel spreadsheet (Excel, Microsoft Corporation, Redmond, Wash.); therefore, users should only enter the values of input parameters into the spreadsheet in order to obtain the estimator outputs.2.2. Modifications required for the integrated estimatorIt is necessary to modify the final estimator in order to involve the negative draft force developed by the action of rotating blades. Furthermore, because the blades of the second machine of an active-passive implement must affect the soil that is tilled before by the blades of the first machine, the values of the soil parameters (i.e.c, and) of the second machine must be different from the first one.According to the method presented byAhmadi (2017), the letterPhas been selected to name the force exerted by a blade of a rotary tiller to the cut soil. This force has a significant effect on the amount of torque needed to operate a rotary tiller. However, the value of this force varies with the angular position of the blade. According to the Newtons third law of motion, if the average value of the horizontal component ofPis calculated, the negative draft developed by that blade will be available. Therefore, the rotary tiller negative draft force was estimated using the procedure outlined below (refer toFig. 2for visual definition of parameters):Dividing the time span from the instant when the rotating blade meets the soil to the instant when it reaches to the deepest point of its path into ten equally sized segments, and calculating the corresponding length of soil that is cut during each of the time segments using the procedure given byAhmadi (2017).Calculating the forcePineeded to cut the i-th segment of soil as suggested byAhmadi (2017).Calculating the horizontal component ofPii.e.Pixby multiplyingPiby cos(P) (Pis obtained following the procedure given byAhmadi (2017).MultiplyingPixby the central angle devoted to the i-th segment of the cut soil (i, rad).Calculating.Calculating the average negative draft force developed by a blade using the formula.Obtaining the negative draft force of the machine using the multiplication ofby the number of the rotary tiller blades.Fig. 2.Details of parameters used to calculate rotary tiller negative draft force.Figure optionsAutomated calculation of this procedure using the Microsoft Excel software, led to the first modification of the active-passive estimator utilized in this study.To achieve the second modification of the active-passive estimator, the results of the study carried out bySchjonning and Rasmussen (2000)was considered. They compared the soil strength as well as soil pore characteristics for direct drilled and moldboard plowed soils. The soils studied consisted of a coarse sandy soil, a sandy loam and a silty loam soil. They measured shear strength of soil in the field with a vane shear tester. Furthermore, separate soil samples were used for measuring soil bulk density and soil pore characteristics as well as for estimating soil cohesion and internal friction by a shear annulus method in a lab. Based on the results obtained in the study of Schjonning and Rasmussen, three conversion coefficients were defined for relating cohesion, internal friction, and bulk density of the plowed soil to the corresponding parameters of the direct drilled soil. Therefore, these conversion coefficients (Table 1) were used to change the soil strength and bulk density parameters of the untilled soil (used for the power estimator of the first machine) to the corresponding parameters of the tilled soil (used for the power estimator of the second machine).Table 1.Conversion coefficients used to relate tilled soil strength parameters and bulk density to the corresponding parameters of untilled soil.soil texturecohesion coefficientsinternal friction coefficientsbulk density coefficientscoarse grained0.8510.96medium grained5fine grained0.950.80.94Table optionsOsunbitan et al. (2005)also reported similar tillage effects on soil bulk density of a loamy sand soil in southwestern Nigeria.To inspect and utilize the final estimator conveniently, the modified estimator, which is an Excel spreadsheet file, was attached to this paper as a Supplementary material. Furthermore, since the required calculations are performed based on iteration and repetition procedures that can be conducted using the Macro feature of the Excel software, users should enable the created Macro first. Then the values of variable parameters, including the values of the conversion coefficients, should be entered. Furthermore, in order to have the possibility of arbitrary selection of the implement that meets the soil first, the integers “1” and “2” were considered for passive and active implements respectively. In practice, one of these integers in addition to the parameters of the virgin soil should be given to the estimator, so that the soil parameters of the active and passive machines are correctly adjusted (refer to the attached Excel spreadsheet file).2.3. Verification of the power estimator developed in this studyThe power estimator was verified by comparing the outputs of the written program with the acquired results by other researchers.3. Results and discussion3.1. Effect of the active-passive velocity and depth ratios on the estimated negative draft forceShinners et al. (1993)have stated that higher negative draft will be developed from an integrated tillage implement having greater velocity and active-passive depth ratios. To examine the estimator from this point of view, values of working state parameters of the estimator were changed so that three different velocity ratios(2.1:1,4.2:1,6.2:1)and three different depth ratios(0.25:1,0.5:1,0.75:1)were resulted, while the values of other parameters of the estimator were unchanged. Moreover, the unchanged parameter values were the same as the values utilized in the study ofManian and Kathirvel (2001). Then, negative draft forces resulted from different combinations produced by the velocity and depth ratios were estimated. The obtained results are summarized inFig. 3.Fig. 3.Trend of the negative draft force variation as a function of the active-passive velocity and depth ratios.Figure optionsThe only point that can be inferred fromFig. 3is that the variation trend of the estimated negative draft force as a function of velocity and depth ratios is according to the above-mentioned comment given by Shinners et al. regarding to the negative draft force variation.3.2. Comparison of the estimator outputs and the results ofWeise (1993)The main aim of the study conducted byWeise (1993)was the measurement of the required power for operating an integrated active-passive tillage implement made up of a winged cultivator and a rotary tiller in silt loam and silty clay loam soils. Precise inspection of the Weise article shows that the surface area and the wingspan of the cultivator wing are 4815cm2and 60cm respectively, and each of the four shanks of the cultivator has a working width of 72cm. Furthermore, the rotary tiller consists of 59 blades each having a 5cm cutting length that are spirally located on the surface of an imaginary cylinder with the radius of 25.4cm. For the field tests, depth of the active and passive implements were set to 10 and 25cm respectively, and forward and angular velocities wereand 281rpm respectively (i.e. the active-passive velocity ratio was 14.9 and the active-passive depth ratio was 0.4). The results of the Weise study showed that the draft force of the machine per meter of its working width was about 10kN; moreover, the amount of negative draft produced by the rotating blades was nearly 2.8kN. Furthermore, the rotational power requirement of the active machine was about 45.6kW and drawbar power need of the passive implement was almost 16.7kW. Another important result of the Weise study is that an increase in forward speed fromtoled to a 35kW increase in total power requirement of the active-passive machine.To compare the obtained results of the Weise study, as well as the experimental reports of other researchers with the corresponding outputs of the estimator, values of the estimator input parameters were set as shown inTable 2.Table 2.The values used as the input parameters of the estimator for required definition(a)(b)(c)(d)(e)Rradius of the rotor (m)0.2540.190.380.750.26BLblade length of the rotor (m)0.0250.05BWblade width of the rotor (m)0.030.030.050.020.03Nbnumber of blades per flange ()11462Nfnumber of flanges of the rotary tiller()5951028angular velocity of the rotor (rad/s)29.432310.482.1 to 1014.15dworking depth of the active machine (m)0.10.06 to 0.10.1300.15csoil cohesion (kPa)2010191010angle of soil internal friction (deg)302524.32525soil bulk density (g/cm3)1.40.7 to 1.21.3161.71.7Wwidth of the subsoiler wing (cm)608 to 137.5515bwidth of the subsoiler shank (cm)33331.8tthickness of the subsoiler shank (cm)44447.3Nnumber of the subsoiler shanks ()45344angle of soil-metal friction (deg)2015151520Ansurface area of the subsoiler wing (cm2)48154000481510001000vforward velocity (km/h)20.8 to 3.2681.9 to 4.5soil vertical upheaving (cm)33333OPdisturbed soil overlap percentage (%)00000hworking depth of the passive tool (cm)25122019 to 3020ccsoil cohesion coefficient ()0.950.90.950.90.9csoil internal friction coefficient ()0.90.9csoil bulk density coefficient ()0.940.950.940.950.95Table optionsThe estimator resulted in the following outputs when its inputs were set according to the values given in the column (a) ofTable 2:Net drawbar pull per one meter width of the machine=,Drawbar power of the passive implement=15.6kW,Rotational power of the active machine=68kW,The negative draft force=2.7kN,Total power requirement of the machine in the working speed of=84kW,Total power requirement of the machine in the working speed of=105kW,Increase in total power requirement of the machine perincrease in working speed=21kW.According to the obtained results, the error percentage of the estimator in predicting draft force, rotational power, drawbar power, and negative draft of the examined machine in comparison with the experimental data ofWeise (1993)are 16%, 47%, 6%, and 3%, respectively. Therefore, as far as the estimation of drawbar force and power requirement of an integrated tillage machine is concerned, the developed estimator behaves accurately, but when the estimation of rotational power is requested, the estimator should be utilized carefully.3.3. Comparison of the estimator outputs with the results of the model developed byAnpat and Raheman (2017)Anpat and Raheman (2017)presented a number of mathematical equations (Eqs.(1)(3) regarding the force, torque, and power requirements of a combined cultivator-rotavator machine. They developed their equations using nonlinear regression analysis of the data obtained experimentally while the examined machine worked in a soil bin filled with a sandy clay loam soil. Variables considered in the equations of Anpat and Raheman were the soil cone index, the ratio of the peripheral speed of the rotating blade to the forward velocity of the machine (i.e. active-passive velocity ratio), the ratio of the cultivator working depth to the rotavator working depth (i.e. passive-active depth ratio), and the working width of the machine:equation(1)TurnMathJaxonequation(2)TurnMathJaxonequation(3)P=Dv+TTurnMathJaxonwhereWis the working width of the machine (cm),CI is the soil cone index (kPa),andDRare the active-passive velocity ratio and the passive-active depth ratio, respectively, andD,T, andPare the required draft force (N), torque (Nm), and total power (W), respectively. Unfortunately, direct comparison of the results obtained by Anpat and Raheman and outputs of the estimator developed herein is impossible, because the equations that the estimator is based on them are not functions of the soil cone index. However, as stated byVaz et al. (2011), there are several equations that relate some of the soil physical properties such as moisture content and bulk density to the soil cone index. These equations can act as the connecting formula that makes the aforementioned comparison be rational.Jakobsen and Dexter (1987)developed an appropriate connecting formula (Eq.(4) that is used herein to relate bulk density and volumetric moisture content of soil to its cone index.equation(4)PR=exp(0.89+3b15.98v)TurnMathJaxonwherePRis the soil cone index (MPa),bis the soil bulk density (g/cm3), andvis the soil volumetric moisture content (cm3/cm3). Considering the soil moisture content given in the study of Anpat and Raheman (10.5% dry basis) and converting it tovusing the formula, whereis the dry soil bulk density, final equation that relatesbtoPRwill be available.Now, using the data given in the column (b) ofTable 2, a rational comparison between the results of Anpat and Raheman and the outputs of the estimator developed herein can be performed. In the three parts ofFig. 4, the above-mentioned comparison has been carried out for draft force, torque, and total power requirements of the considered integrated machine.Fig. 4.The correlation between estimated draft force (a), torque (b), and total power (c) using the estimator developed in this study and the model developed in the study ofAnpat and Raheman (2017)for varying depth ratio.Figure optionsIn each of the three figures the upper trend line is for the machine with wider working width (i.e.W=65cm) and the lower one is for the machine with narrower working width (i.e.W=41cm).Fig. 4a shows that the sensitivity of draft force to the depth ratio for the estimator developed herein is very low. Because each line shown inFig. 4a has a very small slope value (m=0.077 and 0.068). (Note: Although it seems that the slopes of the fitted lines are not significant, the ANOVA test verified the opposite at the 5% probability level. To run the ANOVA test, the equality of the outputs of each regression line and the intercept value of that line was considered as the statistical null hypothesis and the program was run. In each case, the null hypothesis was rejected, which means that each of the slope angles is statistically significant.) Furthermore, precise inspection ofFig. 4b shows that because the coefficient of determination of the lines shown inFig. 4b are high (R2=0.918 and 0.928) and the slopes of these lines are close to one (m=0.842 and 0.636), especially for the machine with wider working width (R2=0.918 andm=0.842), the estimator and the model developed by Anpat and Raheman have predicted similar torque values for the considered machine. Finally, the important point that can be deduced fromFig. 4c is that the sensitivity of total power to the depth ratio for the model developed by Anpat and Raheman is very low. Because each cluster of points having similar shape and color inFig. 4c is located almost on an imaginary vertical line. Again, although it seems that the slopes of the fitted lines are not significant, the ANOVA test verified the opposite at the 5% probability level. It should be noted that these conclusions are not absolute, because they have been obtained from considering only these two models. In other words, more comparisons are needed to achieve a fair decision about the accuracy of the model developed in the study ofAnpat and Raheman (2017)and the estimator developed in this study.3.4. Comparison of the estimator outputs with the results ofChamen et al. (1979)Chamen et al. evaluated the performance of an active-passive tillage implement composed of a power take-off driven rotor and chisel tines having rigid shanks. The examined chisel tines were located behind the active rotor. The ability of working in heavy soils was the first priority considered for this machine. Furthermore, a thorough analysis considering the active machine showed that a bite length equal to 250mm had the best performance in comparison with the other bite length values. To achieve this bite length, 4 L-shaped blades were bolted on one side of the extended flange to give the rotor radius of 0.38m, and the angular velocity of the rotor was set to 100rpm. Among the results of the study conducted by Chamen et al. two of them are about the power requirements of the machine. The first one says that more than 80% of the machine power consumption is devoted to rotational power of the rotor, and the second one says that in clay loam and silty clay loam soils, 117 and 156kJ of energy is needed to till one cubic meter of soil, respectively.To compare the outputs of the estimator with the results of Chamen et al., input parameters of the estimator were adjusted according to the values given in column (c) ofTable 2. Moreover, the soil conversion parameters were applied to the soil parameters of passive implement (i.e. chisel tines) instead of active one. According to the obtained results, 85% of the total power was consumed by the operation of the active machine and the volumetric energy consumption of the machine for tilling a heavy soil was estimated to be.3.5. Comparison of the estimator outputs with the results obtained byShinners et al. (1993)Shinners et al. tested an experimental tillage machine that combines rotary-powered tillage elements with conventional chisel tines in a field having silt loam soil. They investigated the effects of active-passive depth and velocity ratios as well as forward speed on machine performance. They used two large diameter flanges each of them having 6 straight blades as the active machine (diameter of the surrounding circle of the blade tips was 1.5m). Angular velocity of the rotor varied in the range (21103rpm), but its working depth was exactly adjusted to be 30cm. Depth and forward speed of chisel tines were set so that the values of velocity ratio varied in the range (1.52.5) and the values of depth ratio varied in the range (11.6). Other parameters of the machine used in the study of Shinners et al., had the values equal to what has shown in column (d) ofTable 2. Comparison of the results obtained by Shinners et al. and the corresponding outputs of the estimator is shown inFig. 5. This figure summarizes the results obtained when the velocity ratio is equal to 1.5, the depth ratio varies in the range of 11.6, and the machine forward speed has been set toand.Fig. 5.The correlation between estimated draft force (a), PTO power (b), and draft power (c) using the estimator developed in this study and the model developed in the study ofShinners et al. (1993)for varying depth ratio.Figure optionsAs can be seen, the slope of lines depicted inFig. 4a and c are close to one (m=1.195 and 1.373). Furthermore the intercept value of these lines are low by comparison with the range of data being compared (b=1.118 and 1.308), and their coefficient of determination are high (R2=0.969 and 0.951). These results imply that the estimator is suitable for predicting draft force and power requirements of the considered machine. Another important point deduced fromFig. 5b is that each cluster of points having the same shape and color is located on a horizontal line. In other words, the calculating formula of the required PTO power that has been entered into the estimator developed herein does not depend upon the parameter of depth ratio. This conclusion is rational, because in the study of Shinners et al. variation in depth ratio has been resulted from the variation in the working depth of the passive implement, and the working depth of the active machine was considered constant. Therefore, it is expected to have similar PTO power requirements considering this machine working with different depth ratios (Note: Albeit the velocity ratio of the machine should be considered constant).3.6. Comparison of the estimator outputs and the results ofManian and Kathirvel (2001)The effect of soil, machine and operational parameters on the power requirements of an active-passive tillage machine consisting of 16 active blades and four chisel type shares with provision to alter the depth of passive implement with respect to the active one was investigated in the study of Manian and Kathirvel. They selected a black clay loam soil for performing experiments. Furthermore, the selected levels of soil and machine parameters were set equal to the values given in column (e) ofTable 2.Fig. 6compares different results obtained from the study of Manian and Kathirvel with their corresponding outputs resulting from the estimator developed in this study.Fig. 6.The correlation between estimated draft force (a), torque (b), draft power (c), PTO power (d), and total power (e) using the estimator developed in this study and the model developed in the study ofManian and Kathirvel (2001).Figure optionsFrom the mathematics viewpoint, when the slope of a correlation line between the values of a parameter obtained from two models is nearly one and the intercept of the correlation line is small in comparison with the data being compared, it is expected that the two models have similar results with respect to that parameter. Based on the aforementioned criteria,Fig. 6shows that the estimator developed in this study will predict the values of draft power, PTO power, total power and required torque of the machine fairly well (slope values of the corresponding lines are equal to 1.187, 0.725, 1.089, and 0.741 respectively; intercept values of lines are equal to 1.8, 1.599, 0.769, and 97.82 respectively; and coefficient of determination values of lines are equal to 0.991, 0.999, 0.999, and 0.99 respectively), but it will overestimate the value of draft force, especially when the forward speed of the machine is low. (Note: The statistical ANOVA test approved that the slope of the fitted line shown inFig. 6a is significant at the 5% probability level.)4. ConclusionCombining active and passive tillage elements leads to several benefits such as improvement of overall efficiency of the combined machine, utilization of negative draft created by the operation of the active machine, stabilization of the working depth of the machine and so on. Therefore, in this study, power requirement of an active-passive tillage machine was investigated using a theoretical procedure. The two previously developed models regarding the power needs of a rotary tiller and a subsoiler were modified in order to involve the calculation of negative draft and to introduce and apply the soil conversion coefficients to be used in the calculator of the second machine. Then the modified models were integrated. To simplify execution of the required calculations, all of the mathematical formulas were entered into a worksheet of the Microsoft Excel software. Verification of the integrated estimator was carried out by comparing the estimator outputs with experimental results obtained by other researchers. The majority of the estimator outputs were fairly aligned with the results obtained by other researchers; however, there were also some outputs that should be interpreted carefully with respect to their usage limitations.AcknowledgementThe author is grateful to the anonymous reviewers who devoted their invaluable time to inspect the manuscript.Appendix A.Supplementary dataThe following are Supplementary data to this article:Help with XLS filesOptionsHelp with XLSX filesOptionsReferences. Ahmadi, 2016 I. AhmadiEffect of soil, machine, and working state parameters on the required draft force of a subsoiler using a theoretical draft-calculating modelSoil Res. (2016)/10.1071/sr16193(in press). Ahma
- 温馨提示:
1: 本站所有资源如无特殊说明,都需要本地电脑安装OFFICE2007和PDF阅读器。图纸软件为CAD,CAXA,PROE,UG,SolidWorks等.压缩文件请下载最新的WinRAR软件解压。
2: 本站的文档不包含任何第三方提供的附件图纸等,如果需要附件,请联系上传者。文件的所有权益归上传用户所有。
3.本站RAR压缩包中若带图纸,网页内容里面会有图纸预览,若没有图纸预览就没有图纸。
4. 未经权益所有人同意不得将文件中的内容挪作商业或盈利用途。
5. 人人文库网仅提供信息存储空间,仅对用户上传内容的表现方式做保护处理,对用户上传分享的文档内容本身不做任何修改或编辑,并不能对任何下载内容负责。
6. 下载文件中如有侵权或不适当内容,请与我们联系,我们立即纠正。
7. 本站不保证下载资源的准确性、安全性和完整性, 同时也不承担用户因使用这些下载资源对自己和他人造成任何形式的伤害或损失。

人人文库网所有资源均是用户自行上传分享,仅供网友学习交流,未经上传用户书面授权,请勿作他用。
 川公网安备: 51019002004831号