过程管理封皮.doc

远舰汽车变速器设计【两轴式五档手动】【7张CAD图纸】【汽车车辆专业】

收藏

资源目录
跳过导航链接。
远舰汽车变速器设计【全套CAD图纸+毕业论文】【汽车车辆专业】.rar
远舰汽车变速器设计
过程管理封皮.doc---(点击预览)
输出轴倒档齿轮.dwg---(点击预览)
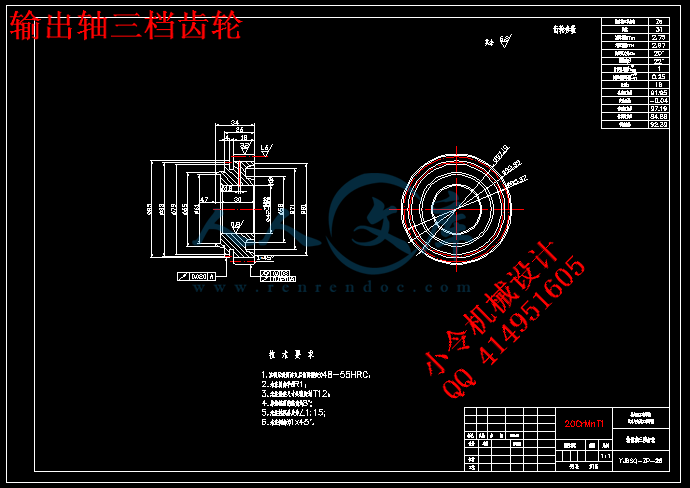
输出轴三档齿轮.dwg---(点击预览)
输入轴五档齿轮.dwg---(点击预览)
设计说明书.doc---(点击预览)
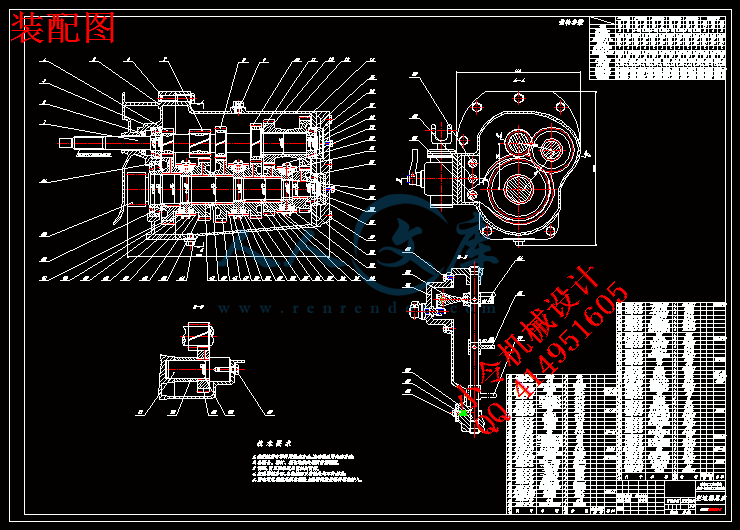
装配图.dwg---(点击预览)
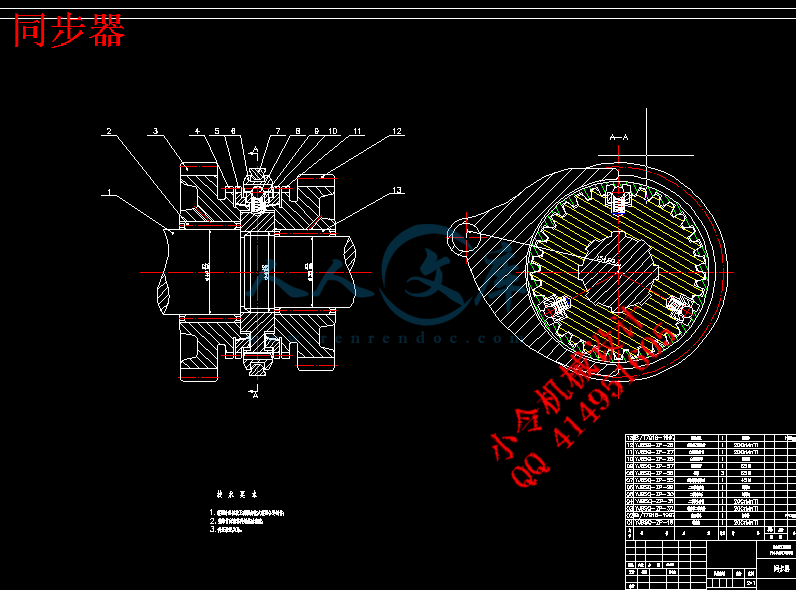
同步器.dwg---(点击预览)
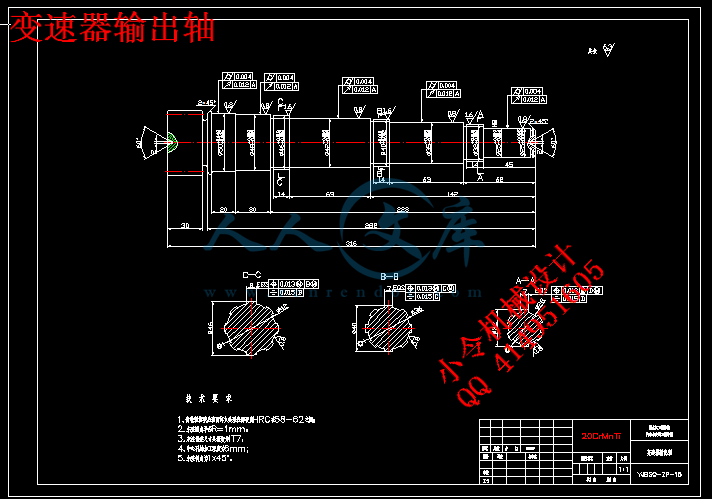
变速器输出轴.dwg---(点击预览)
变速器输入轴.dwg---(点击预览)
10.优秀毕业设计.doc---(点击预览)
09.毕业设计(论文)成绩评定表.doc---(点击预览)
08.毕业设计答辩评分表.doc---(点击预览)
07.毕业设计评阅人评分表.doc---(点击预览)
06.毕业设计指导教师评分表.doc---(点击预览)
05.毕业设计中期检查表.doc---(点击预览)
04.指导记录.doc---(点击预览)
03.开题报告.doc---(点击预览)
02.任务书.doc---(点击预览)
01.题目审定表.doc---(点击预览)
附加资料
压缩包内文档预览:
预览图
编号:402787    类型:共享资源    大小:42.55MB    格式:RAR    上传时间:2015-02-06 上传人:好资料QQ****51605 IP属地:江苏
45
积分
关 键 词:
汽车 变速器 设计 全套 cad 图纸 毕业论文 车辆 专业
资源描述:

【温馨提示】 购买原稿文件请充值后自助下载。

[全部文件] 那张截图中的文件为本资料所有内容,下载后即可获得。


预览截图请勿抄袭,原稿文件完整清晰,无水印,可编辑。

有疑问可以咨询QQ:414951605或1304139763

摘  要
在汽车行驶时的动力传递过程中,变速器是其中的重要环节。汽车变速器是汽车传动系统的主要组成部分,主要作用是将发动机的转矩经过改变后传递给主减速器,最终将动力有效而经济地传至驱动车轮,以满足汽车的使用要求。设置空档用来中断动力传递,设置倒档,使汽车能够倒退行驶。
本设计以现有企业正在生产的远舰汽车变速器为基础,在给定发动机输出转矩、转速及最高车速、总质量、车轮滚动半径等条件下,着重对变速器齿轮的结构参数、轴的结构尺寸等进行设计计算;并对变速器的传动方案和结构形式进行设计;同时对操纵机构和同步器的结构进行设计;从而提高汽车的整体性能。
文中对变速器的主要参数进行验证,包括齿轮强度的校核、变速器轴强度和刚度的校核、轴承寿命的验算等,计算结果表明整体性能满足要求。


关键词:两轴式;变速器;齿轮;同步器;设计;校核
ABSTRACT
In the process of power delivery of the auto movement, transmission is the necessary link. Auto transmission is the main component of the drive train, the main effect is to transfer torque from engine to final drive through by changing gear ratio is to expand the scope and speed to adapt to the driving conditions effectively and economically. Setting neutral is to interrupt power transmission; Setting up to reverse, the vehicle can drive back.
The design based on the existing enterprises production Yuanjian Transmission, In conditions that knowing the engine output torque speed of engine and maximum speed of vehicles, maximum degree, focus on the designing of transmission gear structural parameters, axis geometry design computation; as well as the transmission and drive program structure design; Meanwhile on the structure of components to manipulation and synchronous design; thereby enhancing the overall performance of cars.
The main parameters for transmission have been checked, including the strength of gear, the transmission shaft strength and stiffness of the coupling, Bearing life, results show overall performance meet the requirement.


Key words: Twin-shaft; Transmission; Gears; Synchronizer; Design; Parameters

目  录
摘要 I
ABSTRACT II
第1章 绪论 1
1.1 概述 1
1.1.1 汽车变速器的设计要求 1
1.1.2 国内外汽车变速器的发展现状 2
1.2 设计的内容及方法 2
第2章 变速器传动机构与操纵机构方案选择 4
2.1 变速器传动机构布置方案 4
2.1.1 变速器传动方案分析与选择 4
2.1.2 倒档布置方案 4
2.1.3 零部件结构方案分析 5
2.2 变速器操纵机构布置方案 7
2.2.1 概述 7
2.2.2 典型的操纵机构及其锁定装置 8
2.3 本章小结 10
第3章 变速器传动机构的设计与计算 11
3.1 变速器主要参数的选择 11
3.1.1 档数 11
3.1.2 传动比范围 11
3.1.3 变速器各档传动比的确定 11
3.1.4 中心距的选择 14
3.1.5 变速器的外形尺寸 15
3.1.6 齿轮参数的选择 15
3.1.7 各档齿轮齿数的分配及传动比的计算 16
3.1.8 变速器齿轮的变位 19
3.2 变速器齿轮强度校核 23
3.2.1 齿轮材料的选择原则 23
3.2.2 变速器齿轮弯曲强度校核 23
3.2.3 轮齿接触应力校核 27
3.2.4 倒档齿轮的校核 31
3.3 轴的结构和尺寸设计 32
3.3.1 轴的工艺要求 33
3.3.2 初选轴的直径 33
3.3.3 轴最小直径的确定 34
3.4 轴的强度验算 35
3.4.1 轴的刚度计算 35
3.4.2 轴的强度计算 42
3.5 轴承选择与寿命计算 48
3.5.1 输入轴轴承的选择与寿命计算 49
3.5.2 输出轴轴承的选择与寿命计算 52
3.6 本章小结 53
第4章 变速器同步器及操纵机构的设计 54
4.1 同步器 54
4.1.1 同步器工作原理 54
4.1.2 惯性式同步器 54
4.1.3 锁环式同步器主要尺寸的确定 56
4.1.4 主要参数的确定 56
4.2 操纵机构 59
4.2.1 概述 59
4.2.2 典型操纵换档机构 59
4.3 变速器壳体 60
4.4 本章小结 60
结论 61
参考文献 62
致谢 63
附录A1 64
附录A2 67

第1章  绪  论
1.1概述
随着汽车工业的迅猛发展,车型的多样化、个性化已经成为汽车发展的趋势。而变速器设计是汽车设计中重要的环节之一。它是用来改变发动机传到驱动轮上的转矩和转速,目的是适应汽车在起步、加速以及克服各种道路障碍等不同行驶条件下对驱动车轮的不同要求的需要,使汽车获得不同的牵引力和速度,同时使发动机在最有利的工况范围内工作。因此它的性能影响到汽车的动力性和经济性指标,对乘用车而言,其设计意义更为明显。在对汽车性能要求越来越高的今天,车辆的舒适性也是评价汽车的一个重要指标,而变速器的设计不合理,将会使汽车的舒适性下降,使汽车的运行噪声增大,影响汽车的整体性。
1.1.1汽车变速器的设计要求
汽车传动系是汽车的核心组成部分。其任务是调节、变换发动机的性能,将动力有效而经济地传至驱动车轮,以满足汽车的使用要求。变速器是完成传动系任务的重要部件,也是决定整车性能的主要部件之一。变速器的结构要求对汽车的动力性、燃料经济性、换档操纵的可靠性与轻便性、传动平稳性与效率等都有直接的影响。随着汽车工业的发展,轿车变速器的设计趋势是增大其传递功率与重量之比,并要求其具有更小的尺寸和良好的性能。在汽车变速器的设计工作开始之前,首先要根据变速器运用的实际场合来对一些主要参数做出选择。主要参数包括中心距、变速器轴向尺寸、轴的直径、齿轮参数、各档齿轮的齿数等。

内容简介:
IEEE Vehicle Power and Propulsion Conference (VPPC), September 3-5, 2008, Harbin, China 978-1-4244-1849-7/08/$25.00C2008 IEEE Application of Automatic Manual Transmission Technology in Pure Electric Bus Xi Jun-qiang * and Xiong Guang-ming * and Zhang Yan * Beijing Institute of Technology/School of Mechanical and Vehicular Engineering, Beijing, China. Email: * Beijing Institute of Technology/School of Mechanical and Vehicular Engineering, Beijing, China. Email: AbstractTwo-speed transmission system is usually employed by an electric vehicle to improve efficiency of an electric driving system and drivability of vehicle powered solely by electric power, i.e. pure electric vehicle, or series hybrid electric vehicle. The improvement of the drivability and efficiency due to the application of the multi-speed transmission system is shown based on motor drive system characteristics, traction characteristics and cost. Moreover, in addition to optimization of multi-speed automatic manual transmission (AMT) system and motor drive system, integrated control technology and multi-speed AMT system without clutch is also introduced. With the result of conducting field test and on-road test, it is obvious to see that the drivability and efficiency of vehicle provided with multi-speed AMT system is significantly improved. Keywords Pure Electric Bus; Automatic Manual Transmission; Power Transmission Integration Control I. INTRODUCTION To improve efficiency of an electric driving system meanwhile to meet the requirements of vehicle drivability, the driving motor of the pure electric vehicle or series hybrid electric vehicle is usually provided with a decelerator or a transmission device. Conventionally, a two-speed planetary gear transmission device is employed by the pure Electric vehicle or series hybrid electric vehicle. The structure of the two-speed planetary gear transmission device is relatively simple. However, a shift operation can not be performed when the vehicle is running, which makes it difficult to optimize the drivability and the efficiency. Accordingly, based on the motor drive system characteristics and the overall requirements of the vehicle, the feasibility and optimization as well as control strategy of applying AMT without clutch to the pure Electric vehicle or series hybrid electric vehicle are presented. An AMT system which is suitable for both the pure Electric vehicle and the series hybrid electric vehicle is presented as well. Excellent testing results indicate that the drivability and efficiency is significantly improved. Prototypes of said AMT system have been installed in the pure Electric bus for serving the coming Beijing Olympic Games. II. NECESSITY OF EMPLOYING MULTI-SPEED AMT SYSTEM A. Requirements of drivability Fig. 1 illustrates a characteristic curve of a driving motor installed in an electric vehicle. Referring to Fig. 1, the maximum torque obtained in a low rotation speed cannot meet mass transit requirements, for example, acceleration and hill climbing. Therefore the pure Electric vehicle or series hybrid electric vehicle needs to be provided with an AMT system according to the drivability requirements1. Fig. 2 illustrates a traction characteristic curve of a driving motor provided with a three-speed AMT according to the overall requirements of an electric vehicle. As shown in Fig. 2, though a two-speed transmission device may meet operation requirements, high power loss cannot be avoided. Compared to the two-speed transmission device, a multi-speed transmission device can make a good use of the power output of the motor with reference to the traction characteristic curve shown in Fig. 2. Torque (Nm) Rotary Speed (revolution per minute) Fig. 1 Torque characteristics of driving motor Vehicle Speed (kilometer per hour) Fig. 2 Traction characteristic curve of a driving motor Driving Force (KN) 050001000015000200002500030000350004000045000500000 10 20 30 40 50 60 70 80 90 Authorized licensed use limited to: CHONGQING UNIVERSITY. Downloaded on September 13, 2009 at 06:17 from IEEE Xplore. Restrictions apply. IEEE Vehicle Power and Propulsion Conference (VPPC), September 3-5, 2008, Harbin, China 978-1-4244-1849-7/08/$25.00C2008 IEEE B. Requirements of efficiency In addition to the drivability, the optimization of driving cycles and motor drive system is also determined by a fixed shift level and a fixed speed ratio. Fig. 3 illustrates an efficiency map of a motor drive system. As shown in Fig. 3, the high efficiency range is limited. Fig. 4 illustrates an efficiency curve of a motor drive system provided with a three-speed transmission system. Referring to Fig. 4, a high efficiency curve over a much wider range is offered, which indicates an improvement of the output of the motor drive system provided with the three-speed transmission device. C. Requirements of operability To improve the drivability and the efficiency, in other words, to improve the operability of the vehicles, there is a need to apply an automatic transmission system to the electric vehicle. A gear set of a conventional pure Electric vehicle provided with the two-speed transmission device, however, can not be shift automatically when the vehicle is in drive. The operator has to stop the engine and shift manually. Consequently, the drivability and efficiency is limited to some degree. III. INTEGRATION OF MOTOR DRIVE SYSTEM AND MULTI-SPEED TRANSMISSION SYSTEM. A. Design of integration of power and transmission system Automatic transmission system, such as AT, AMT CVT and DCT are widely used in vehicles nowadays. However, CVT and DCT are not suitable to bus or commercial vehicles. For energy security and strict environmental requirements, AMT system is more suitable to be applied to electrical vehicles due to its high efficiency and low cost. However, a clutch apparatus is a must for a conventional electric vehicle equipped with an AMT system, as illustrated in Fig. 5. . A new electric vehicle is thus presented as shown in Fig. 6. In this new electric vehicle, the AMT system is integrated with the motor drive system. An integrated automatic control system configured to operate the integrated system is provided according to the analysis of motor drive system characteristics and the shift. As a result, the clutch apparatus is not required. The transmission efficiency is thus optimized which results in an improvement of the efficiency of the transmission system。 B. Integrated control of a power transmission system. The integrated control is achieved by a high speed CAN bus and two electric control units (ECU). A work procedure of the power transmission system is divided into five phases and shown in Fig. 7 : entering a neutral gear position; adjusting output of the engine; selecting an engagement position; synchronizing for a next shift position; changing shift level to enter the next shift position. The work procedure is controlled by a transmission control system 2, C. Design of AMT shift schedule By optimizing battery, power transmission system and the vehicle, a specific transmission control strategy is designed for the pure electric bus. The energy stored in the battery is effectively supplied meanwhile high efficiency of motor drive system and its control system is obtained. The designed electric vehicle follows an deactivated shift schedule determined by dual-parameter. As illustrated in Fig. 8, the engagement point varies with vehicle speed and throttle position. Wide throttle opening may ensure the drivability and a reduced throttle Fig. 4 Efficiency curve of a motor drive system Rotary Speed (revolution per minute) Fig. 3 Efficiency map of a motor drive system 。low efficiency point + high efficiency point Torque (Nm) Fig. 6 Structure of an integrated automatic power transmission system Integrated Automatic Power TransmissionDiffer-entialMotorGear BoxDiffer-entialClutchFig. 5 Structure of a conventional electric vehicle according to prior artAuthorized licensed use limited to: CHONGQING UNIVERSITY. Downloaded on September 13, 2009 at 06:17 from IEEE Xplore. Restrictions apply. IEEE Vehicle Power and Propulsion Conference (VPPC), September 3-5, 2008, Harbin, China 978-1-4244-1849-7/08/$25.00C2008 IEEE opening may improve the efficiency. Meanwhile, dual-parameter shifting regularity is optimized by inactivating shifting strategy. If just use dual-parameter to control shifting, shifting disturbance which is not expected may happen, because the shifting regularity is sensitive to the throttle opening signal which changes in large extent and frequently. What is called inactive shifting strategy is that weaken shifting disturbance led by the control parameter of throttle opening and reduce the sensitivity of shifting control when the throttle opening changes sharply. IV. TEST RESULT Tests were performed with a BK6122EV2 pure electric bus . As shown in Fig. 9,the weight of this bus(fully loaded) is 18000kg,and the rated passenger capacity is 50 persons with the maximum speed 80Km/h; The type of the driving motor is YDB160-6-F,the rated power capability: 100KW,the maximum power: 160KW,the rated torque: 514N.m,the maximum torque: 800N.m,the rated rotate speed: 200rpm,the maximum rotate speed: 4500rpm.The type of the transmission is 4A110 (three-speed automatic manual transmission) with the maximum output torque 1100N.m.The transmission ratio of first gear to third gear is 4.403、2.446 and 1.507.Lithium battery is used as power battery and its total voltage is 388V with the total capacitance 360Ah. Both the drivability and efficiency are improved using the integrated multi-speed power transmission system. Fig. 10 illustrates energy consumption curves of a vehicle provided with the multi-speed power transmission system in AMT mode, two-speed mode and three-speed respectively, the energy consumption decreases 9% when using the AMT. Table 1 shows the acceleration time of an electric vehicle, the acceleration time is shortened 18% when using the AMT V. CONCLUSIONS V. CONCLUSION The pure Electric vehicle provided with multi-speed AMT system solves the cons for using the two-speed planetary gear transmission device, i.e. the motor drive characteristics cannot be made good use of. Hence, the drivability and the efficiency as well as the operability are improved. Prototypes of said AMT system have been installed in the 50 BK6122EV2 pure Electric buses for 050km/h Acceleration time with fixed second gear (s) 28.3 Acceleration time with AMT (s) 23.2 Fig. 7 Shift up sequence Selection Position Shift Position Operating Mode of Motor Position Gear Rotary Speed of Motor throttle Position 102030405060708090100101520253035404550Vehicle speed(km/h)Throttle positon(%)Fig. 8 Shift schedule TABLE 1 ACCELERATION TIME OF AN ELECTRIC VEHICLEFig. 10 Comparison curves of Energy consumption between AMT and fixed gearThe overall energy consumption The overall energy consumption except air condition consumptionThe energy consumption of motor 1.551.811.481.061.301.130.911.141.000.000.501.001.502.00AMT The second gear The third gear Fig.9 BK6122EV2 pure electric bus Authorized licensed use limited to: CHONGQING UNIVERSITY. Downloaded on September 13, 2009 at 06:17 from IEEE Xplore. Restrictions apply. IEEE Vehicle Power and Propulsion Conference (VPPC), September 3-5, 2008, Harbin, China 978-1-4244-1849-7/08/$25.00C2008 IEEE serving the coming Beijing Olympic Games. It is also applied in the hybrid buses. REFERENCES: 1 Xiao Zhizeng. Studying on pure electric vehicle with Automatic Manual Transmission D. School of Mechanical and Vehicular Engineering, Beijing Institute of Technology,2006,7 2 Hu Yuhui, Xi Junqing, Chen Huiyan. Coordination control technology based on CAN bus in process of shifting J.Chinese Journal of mechanical engineering, 2006, 42, supp:209-213 Authorized licensed use limited to: CHONGQING UNIVERSITY. Downloaded on September 13, 2009 at 06:17 from IEEE Xplore. Restrictions apply. A GENETIC ALGORITHM APPROACH TO MINIMIZETRANSMISSION ERROR OF AUTOMOTIVE SPUR GEAR SETSD. J. Fonseca and S. Shishoo&Department of Industrial Engineering,The University of Alabama, Tuscaloosa, Alabama, USAT. C. Lim&Department of Mechanical Engineering, The University of Cincinnati,Cincinnati, Ohio, USAD. S. Chen&Department of Industrial Engineering, The University of Alabama,Tuscaloosa, Alabama, USA&As the quietness of vehicles has improved in recent years, there have been stricter requirements toreduce gear vibration and noise and thereby improve transmission quality. The prediction of gearvibration and noise has always been a major concern in gear design. It is widely accepted that theacoustic noise generated by a pair of gears is strongly related to the gears transmission error.Recently, greater emphasis has been placed to further optimize the gear tooth parameters in orderto reduce transmission error and, subsequently, improve the dynamic performance of transmissionsystems.This paper discusses the development of a genetic algorithm (GA) model to minimize theweighted sum of the magnitudes of gear mesh frequency components. The GA algorithm wasdesigned based on a mathematical formulation for computing static transmission error and loadsharing for low-contact-ratio external spur gears. The constructed GA was able to overcome the localoptima and achieve global optimal=near-optimal solutions.A typical automotive gearbox system consists of gears, shafts, bearings,and housings. One of the most commonly used types of gears in a gear-box is the spur gear. Spur gears are power-transfer mechanisms in whichthe tooth configuration lies parallel to the axis to rotation. They essen-tially transmit power between two parallel shafts. Today, automotivedesigners face increasing challenges in the design of automotive trans-missions to minimize gear vibration and noise. The vibration caused bythe fluctuation in the tooth engagement process generates gear noise thatis highly tonal in nature. This vibration can be transmitted structurallyAddress correspondence to D. J. Fonseca, Department of Industrial Engineering, The University ofAlabama, P.O. Box 870288, Tuscaloosa, AL 35487-0288, USA. E-mail: dfonsecaApplied Artificial Intelligence, 19:153179, 2005Copyright # Taylor & Francis Inc.ISSN: 0883-9514 print/1087-6545 onlineDOI: 10.1080/08839510590901903into the car body, and radiated off as sound waves. The prediction ofgear vibration and, ultimately, noise has always been a major concernin gear design. Why some gear designs are inherently quite while othersseem to defy all attempts to subdue noise is a question faced by gearengineers. Gear noise is generally difficult to tackle due to the com-plexity of the tooth form, and a number of others factors affecting theoverall mechanism design (Attia 1989).There are several possible causes of gear vibration generated from thetooth contact forces. Theoretically, load transfer from one tooth to anotherhappens at a contact point called the pitch point that lies on the pitch cir-cle diameter of the two gears (Smith 1983). If the force at this point variesin amplitude, direction, or position, vibration is produced. Studies haverevealed that most of the gear noise is characterized by components atthe gear mesh frequency, and its harmonics (Houser 1986). The gear meshfrequency is the inverse of the time period between consecutive toothmeshes, and it is computed by multiplying the number of teeth on a gearby its rotational velocity. Additional factors such as gear tooth impacts at theinitiation of tooth contact, changes in frictional forces due to gear toothsliding, changes in mesh stiffness, and transmission errors have contributedto the gear dynamic forces, which are periodic at the gear mesh frequency(Houser and Tavakoli 1984).Transmission error (TE) is defined as the deviation in rotation from itsideal position, as the gear pair is rotated under constant torque (Welbourn1979). It is expressed as an angular displacement, or alternately, as a lineardisplacement at the pitch point along the line-of-action. As mentioned ear-lier, the main causes of the transmission error at the meshing frequencyand its harmonics are the non-ideal tooth profile, and the elastic deflectionof the gear tooth due to the transmitted load (Sundersan et al. 1990). Thenon-ideal profile of the tooth is the basic cause of the transmission error inunloaded gears. This non-conformity to the ideal profile can be due tomanufacturing errors and designed tooth modifications. When loaded,the tooth deflections and the changes in rotational deflections due to meshstiffness also cause transmission error. Transmission error is of direct impor-tance in gear vibration analysis since it is the prime source of acoustic noisein the system.Gear design is a complex procedure that involves optimization ofdesign parameters in order to attain the best vibration and durability per-formances of a gear set. The designer has a multiplicity of goals, includingbending and pitting stresses under an allowable limit, minimizing scoring,and achieving minimum design noise (Houser et al. 1998). Typical objec-tives can be weight, space, and load capacity. Researchers dealing with gearoptimization have often used relatively simple objective functions becauseof the disadvantages of finding the global optimum efficiently when the154D. J. Fonseca et al.objective function becomes non-linear or discontinuous. Usually, complexsystem models for gear design have been over-simplified in order to allowthe application of optimization techniques. Because of the inherentassumptions taken, the optimum solutions rarely prove to be practical.The slight variations from the optimum values can diminish the optimiza-tion effects considerably. According to Houser et al. (1998), if there aremany design responses in the objective function, it is difficult for thedesigner to quantify the importance of each response, and hence, evenslight changes can result in different optimum solutions. Many of thedesign and manufacturing constraints for optimum gear design are non-linear, and discrete in nature, which limits the application of traditionaloptimization methods. Enumeration methods have been employed inrecent times to perform design simulations of a large number of geardesign cases. Although enumeration methods give the optimum solutionfor the objective function, they are not effective for a large solutionspace (Houser et al. 1998; Sundersan et al. 1990; 1989). There is a lackof robust and effective optimization schemes to realistically model the gearnoise phenomenon and relate it to gear design parameters. The gearoptimization problem admits many design solutions, and often, the oneto be selected is that which adapts best to the working environment. Thispaper focuses on the use of genetic algorithms to address such a designproblem.LITERATURE REVIEWHarris (1958) was one of the first researchers to effectively model thespur gear teeth and recognize the importance of transmission errors.Optizs survey in 1969 entitled Noise of Gears provided data relatingvarious gear parameters to the resulting noise. His curves for gear noiseare widely used for acceptance testing of gears, and thus, the implicitassumptions in them are worth examining. They suggest that if two gear-boxes are designed so that one transmits twice the power of the other,then the more powerful gearbox would be 3 dBA noisier. Inspection ofOpitzs global data on gears suggests that the noise produced in dBA isdirectly proportional to the manufacturing transmission error (Optiz1969).Niemann and Baethge (1970) investigated the relationship betweentransmission error (TE) and acoustic noise. They showed how tooth bend-ing changes the contact ratio for both spur and helical gears. Following onHarriss work, they measured, using seismic equipment, the gear TE in aback-to-back test rig under the influence of increasing loads. Using longtip relief, they confirmed how a spur gear could be designed to have itsminimum TE at the design load.Minimize Error of Gear Sets155Remmers (1972) developed spur gear transmission error models, whichapproximate the gear tooth as a cantilever beam. The models includeddeflections due to bending, shear, and base rotation of the tooth, as wellas Hertzian deflection at the contact zone.Estrin (1980) suggested an optimization method for a gear mesh basedon the application of nonlinear programming techniques. The main toothproportions are calculated to obtain the optimal properties, which satisfythe conditions linked to the strength, durability, noise, and manufacturingof the gears. The nonlinear model involved objective functions for minimiz-ing compressive stresses and maximizing contact ratio and tip thicknesssubject to various design and manufacturing constraints.Houser et al. (1984) developed a mathematical procedure to computestatic transmission errors, and tooth load sharing for low- and high-contact ratio for internal and external spur gears. A suitable optimizationalgorithm based on the Complex Method of Box was used to minimizeany combination of the harmonics of gear mesh frequency components ofthe static transmission error. The ability to predict the effects of off-optimum loads, or nonoptimum manufacturing errors on the trans-mission error was shown to be an important feature of the procedure.Two years later, Houser (1986) also developed a load distribution program(LDP) which uses the Simplex algorithm to solve a set of linear elasticityequations. These equations described the deflections of discrete pointsalong the gear meshing points. He used his program to compute trans-mission errors for a 1:1 ratio set of helical gears. Since that time, hisprogram has been applied widely to the study and design of numeroustypes of gear pairs.Carroll et al. (1989) constructed a dimensionless design solution to thespur gear problem. They introduced a new quantity called the materialproperties relationship factor. Through this approach, they concluded thatthe interaction of the bending stress constraint and one of the two contactstress constraints defines the optimum solution. They showed that, in adimensionless space defined by the new parameters, the optimal geargeometry can be found independently of the load and speed requirementsof the gear set. In cases where gear mesh is designed on American GearManufacturers Association (AGMA) rating equations, the method yieldsthe smallest gear set that would achieve the desired bending and contactstresses.Sundersan et al. (1989) at the Gear Dynamics and Gear Noise ResearchLaboratory at Ohio State University developed a procedure that helpsdesign spur gears with minimum transmission error, while being insensitiveto manufacturing variance. The procedure uses Taguchis concept ofparameter design. The parameter design concept seeks performancevariation reduction by decreasing the sensitivity of an engineering156D. J. Fonseca et al.design to sources of changes rather than controlling such sources. The pro-cedure initially generates candidate gear designs that meet the require-ments of a fixed center distance, reduction ratio, and design torque.These designs also satisfy geometrical constraints, such as avoiding under-cut, having a minimum root clearance, and working depth. These designsare then optimized for minimum transmission error by determining theoptimum profile modification, and at the same time, making them leastsensitive to manufacturing variance. The statistical optimization was carriedout based on Boxs complex method.A unique approach presented by Chandrasekaran et al. (1998) was usedin conjunction with a gear design preprocessor constructed by Regalado toperform design simulations of a large number of gear design cases. In eachcase, over 65,000 designs were evaluated, and the dominance filter resultedin 200 to 900 successful designs, depending on the tolerances applied.Further sorting with the viewer usually ends with 5 to 20 designs of similarperformances.It is clear that various optimization methods have been employed inorder to achieve the best possible set of variables to minimize gear noise.Optimization of gear design is a complicated task, and conventional optimi-zation tools would have real-life difficulties in achieving a global optimum.Some of the more advanced optimization schemes, such as geneticalgorithms, have also been applied, although in a very limited, way to thisproblem.Yokota et al. (1998) used genetic algorithms to address the gear weightproblem. He formulated an optimal weight design problem for a con-strained gear bending strength, shaft torsional strength, and individualgear dimensions as a nonlinear integer-programming problem.Balic et al. (1996) developed an integrated CAD=CAM expert systemnamed STATEX for dimensioning, optimization, and manufacture of gearsand gearing. To determine the optimum dimensions of gearing, the systemuses a genetic algorithm model. The algorithm minimizes the sum ofvolumes of gear pitch cylinder by optimizing on parameters such as mod-ule, number of teeth, tooth width, etc.From the reported literature, it is obvious that the problem of gear opti-mization with relation to gear noise is highly complex, and that there aresignificant limitations for the application of traditional optimization techni-ques to gear noise reduction. Mathematical optimization models are diffi-cult to implement due to the discrete nature of the variables involved,and the complexity of the objective function. The use of more robustand reliable optimization techniques is needed to achieve better solutions.Recently, genetic algorithms have been applied successfully to gear design.Based on the literature findings, the use of genetic algorithms for gearnoise reduction appears to be a promising approach.Minimize Error of Gear Sets157MATHEMATICAL MODELINGMost gear design problems present the following requirements andconstraints:1. Requirements: Fixed center distance, reduction ratio, and designtorque.2. Constraints: Maximum outer diameter, maximum face width, andmaximum stress.Apart from these requirements and constraints, there is a whole array ofdiscrete and continuous variables, which have to be taken care of whiledeveloping the optimization model (Houser 1984).In order to develop an objective function for optimization, a series ofcalculations had to be carried out through a formal methodology such asthe one given by Tavakoli (1983).These steps were:. Determination of ideal involute profile. Profile modification curve-fit. Mesh compliance analysis of the gear pair. Transmission error and load sharing computations.The various assumptions that were taken in development of the mathemat-ical model embedded in the GA-based algorithm were as follows:. Contact is always along the line of action during the duration of a meshcycle. The tooth is assumed to be nonuniform cantilever beam in both bendingand shear analysis. The load is assumed to be uniformly distributed along the tooth facewidth. Spur gears are made of carbon steel. The starting positions of profile modifications were fixed for thisstudy.Involute Profile GenerationThe first step in Tavakolis (1983) method involves the calculation ofthe true involute profile of the tooth. Figure 1 is used here as a guidefor determining the coordinates of the calculation points on a geartooth.158D. J. Fonseca et al.Knowing the thickness at the pitch point Tp, and the operating pressureangle /p, the angle c is given by:c /p? Tp=2 ? Rp1where Rpis the pitch radius. Using the definition of an involute function,angle bjis given by:bj Tan?1Tan/p aj2where ajis the position angle of the jth calculation point defined as thedifference between the roll angle of the jth point and the roll angle of thepitch point.Also:Rj RpCos/p=Cosbj3where Rjis the radius at point j. It follows from the figure:kj bj? c aj4FIGURE 1 Coordinates of jth calculation point on gear tooth.Minimize Error of Gear Sets159Finally, with the origin at the center of the gear, the coordinates of thejth calculation point along the range of contact of a tooth are given by:Xj RjCoskj5Yj RjSinkj6In order to represent the gear tooth by a numerical model, a finitenumber of calculation points are distributed along the tooth profile. Letw define the tooth spacing angle according to:w 2p=N7where N is the number of teeth.Angle w is divided into NJ equal parts, so that a total of 2NJ calculationpoints are defined on a tooth profile and its extension. Each of these pointsis identified by an angle aj, called the position angle, according to:aj jw=NJ j2p=NJN8where ? NJ1?j?NJ. This angle is illustrated in Figure 2. For pointsinside the pitch diameter, j is negative, and for the points outside the pitchcircle, j is positive.Also, the pitch point is marked by aj 0 for which j 0.Figure 2 also shows that contact between the pairs of teeth is theoreticalpossible only when:aa? aj? as9where aaand asare the angles of recess and approach, respectively.Profile Modification Curve-FitProfile modification (or error) is defined as the amount by which theactual profile deviates from the true involute. If the material is removedfrom a tooth, the modification is specified as a negative quantity. Thedesign variables that need to be optimized are the magnitudes of modifica-tions specified at four locations along a tooth profile.The calculation points on the tooth profile are determined using toothgeometry, and these same points are used as contact points during themesh cycle (Tavakoli 1983). Four specific locations along the range of con-tact were chosen as shown in the Table 1.160D. J. Fonseca et al.If the jth calculation point is located between modification points 1and 2, knowing its position angle, aj, the modification at that point canbe calculated by:Zj Z1 aj? a1Z2? Z1=a2? a110Equation (10) is adjusted accordingly and coded if the calculation point islocated between two other modification points (Tavakoli 1983).TABLE 1Location of Calculation PointsPointContact range locationSymbol1The tooth tip.Z42The high point located on the toothprofile between the tip and the operating pitch point.Z33The low point located on the toothprofile between the operating pitchpoint and the first point of contact.Z24The first point of contact.Z1FIGURE 2 Theoretical contact criterion.Minimize Error of Gear Sets161Mesh Compliance AnalysisThe tooth compliance is computed for those calculations that theoreti-cally come into contact during a mesh cycle. The displacements are calculatedin a direction normal to the tooth profiles. The total static compliance of apair of contacting teeth is assumed to be contributed by three sources,namely, cantilever beam deflection due to both bending and shear forces,rigid body tooth rotation at its base, and contact or Hertzian deflection.The gear teeth are modeled as nonuniform short cantilever beams inboth bending and shear with an effective length of Le, which extends fromthe tip to the effective base, MM, as shown in Figure 3.The range of the contact is divided into a sequence of transverse seg-ments of rectangular cross section. Each section is denoted by the indexi. For each segment, the height, the cross-sectional area (Ai), and the areamoment of inertia (Ii) are taken as the average of these values at both faces.The total deflection is obtained by superimposing the contributions of indi-vidual segments. Each segment itself is considered as a cantilever beam withits left face as the fixed end, and the remainder of the tooth adjacent to theright face as a rigid overhang. According to Tavakoli (1983), the totaldeflection at the load position due to bending is:D11i WjCosbj2L3i 3L2iSij=6EeIi11D21j WjCosbjL2iSij=2EeIi12FIGURE 3 Spur gear tooth modeled as a non-uniform cantilever beam.162D. J. Fonseca et al.The deflection of the section due to moments is given by:D12i WjSijCosbj ? YjSinbjL2i 2LiSij=2EeIi13D22i WjSijCosbj ? YjSinbjLiSij=EeIi14where Wjis the normal load at point j on the tooth profile, Sijis themoment arm, Liis the tooth segment thickness, Iiis the mean area momentof inertia, Yjis the y-coordinate of the contact point, and Eeis the effectiveYoungs modulus of elasticity given as:Ee E=1 ? v215where E is the Youngs modulus of elasticity and v is the Poissons ration. Itis assumed that the gears in question are made of carbon steel. Thedetailed description of the deviation of the above equations is given inTavakoli (1983).The deflection of the tooth due to shear for a rectangular cross sectionis calculated from the following equation:Dsi 1:2 WjLiCosbj=GAi16where G is the shear modulus of elasticity.Once the deflections due to bending and shear are computed, the totaldeflection of a tooth at the load position and in the direction of the appliedload (normal to the profile) is determined by:Dbj RD11i D21i D12i D22iCosbj17The total compliance coefficient due to tooth bending as a cantileverbeam for the jth calculation point, Qbj, is thus given by:Qbj Dbj=Wj18Due to fillet geometry and the flexibility of the tooth support material,the tooth acting as a rigid member rotating in its deflection contributesadditional deflections. The foundation deflection is a function of not onlythe fillet geometry, but also the load position and direction, as indicated byEq. (19). The foundation compliance at the position of the applied load,Minimize Error of Gear Sets163Qfj, is given by:QfjCos2bjFE(5:306Lf=Hf2 21 ? vLf=Hf 1:5341 0:4167tan2bj1 v !)19where Lfand Hfare defined in Figure 4:Lf Xj? XM ? Yjtanbj20Hf 2YM21where XM and YM are the coordinators of the point, which identifies thestart of the effective tooth base (Tavakoli 1983).The gear tooth also has contact deflections due to compression of thetooth between the point of contact and the tooth centerline. A semi-empiri-cal equation developed by Palmgren for contacting cylinders in roller bear-ings was used to calculate contact deflections for gear teeth. The Palmgrenequation for contact compliance of gear teeth is:Qh 1:37=E0:912eF0:8W0:1n22FIGURE 4 Deflection of tooth due to foundation flexibility.164D. J. Fonseca et al.where Wnis the total normal load, F is the face width, and E12eis the com-bined effective Youngs modulus of elasticity given by:E12e 2E1eE2e=E1e E2e23E1eand E2eare the effective Youngs modulus of elasticity for the pinionand gear, respectively. Finally, the total tooth compliance at a point ident-ified by j is given by:Qj Qbj Qfj Qh24Transmission Error and Load Sharing ComputationsThe transmission error for a pair of meshing teeth depends on two mainfactors: the combined compliance of the pair of teeth and the manufactur-ing errors (i.e., tooth spacing error, tooth profile error, and run out error).A conventional set of three equations for load sharing and total trans-mission error for a low contact ration mesh is presented next (Houser1984), where Wnis the total transmitted normal load and Qjis the com-bined compliance of the pinion and gear teeth at the jth calculation pointalong the range of contact,Q0jW0j Etj Ep0j25Q1jW1j Etj Ep1j Es26W0j W1j Wn27Wjis the normal load shared by the same pair of teeth at the same calcu-lation point, and Etis the total transmission error, which is expressed asa linear displacement along the line of contact (Houser et al. 1984). The0 and 1 subscripts refer to the leading and lagging gear pair, respectively.The transmission error is negative if the gear laps the pinion, and positiveif it leads the pinion. The load is assumed to be uniformly distributed alongthe tooth face width.Esis the tooth spacing error, which is positive if the adjacent teeth aretoo close to each other, and negative if they are too far apart. Epis the toothprofile-error, which is positive if material is added to the tooth, and negativeif it is removed.A typical transmission model, containing an objective function in termsof gear parameters, and a set of binding constraints is shown below:Minimize Z XAjWjj 1 to n28Minimize Error of Gear Sets165where Z is the weighted sum of amplitudes of the Fourier spectrum oftransmission error, Ajis the amplitude of the jth mesh harmonic, and Wis the weighing factor for jth mesh harmonic.In general, reduction of the mesh harmonics is likely to lead to areduction of the generated noise from the gearbox. Therefore, reductionof the magnitudes of the significant mesh harmonics is desired.Since the shape of the tooth profiles determines the transmission error,the manufacturer must have control over profile modifications. The designvariables are chosen as the magnitudes of the profile modifications at thetip (Z4), the high point (Z3), the low point (Z2), and the first point of con-tact (Z1), as given in Table 1.A summary of the design variables used in the mathematical modeldescribed earlier is given in Table 2.Due to the inherent discrete nature of the variables as shown in Table 2the mathematical optimization techniques could not be utilized to opti-mize the objective function (Equation 28). Therefore, a robust mechanismsuch as genetic algorithms are used. Genetic algorithms are search algo-rithms developed by Holland in the early 1970s. They are based on themechanics of natural genetics. They combine a Darwinian survival of thefittest approach with a structured yet randomized, information exchange.They search large complex spaces efficiently, and are capable of locatingnear optimal solutions rapidly (Goldberg 1989).THE GENETIC ALGORITHMS APPROACHThe GA model was developed to cater to the needs of manufacturingand production managers, and aid them in decision making on optimalprofile errors for gears. The model was implemented in Visual Basic to esti-mate profile errors for pair of mating gears. Theoretical calculation of theminimum transmission error is time consuming and requires an enumerat-ive-type approach. To overcome this, a GA search mechanism is used toachieve more satisfactory solutions. This model has the ability to analyzedifferent arising scenarios, i.e., to carry out what-if-type analysis. It is aprocess of investigating various alternatives arising in the decision-makingTABLE 2Summary of Design VariablesVariablesSymbolType of variableProfile ModificationsZDiscreteDeflection of the ToothQjDiscreteTransmission ErrorEtDiscreteTooth LoadWjDiscrete166D. J. Fonseca et cess, and providing the decision maker with the possible effects to thevarious alternatives.The user is given full control of guiding the GA search mechanismthrough the selection of various parameters used by the algorithm.Input SpecificationsThe backbone for any system is its input data. For this model, the mostimportant data inputs are the gear design parameters of the two matinggears. Other critical input to the system is the selection of the minimumand maximum allowable profile errors. The decision maker is requiredto make this decision based on experience and design requirements.Default values of the GA parameters assumed by the system are best sui-ted for the problem at hand, but they can be changed as required. Themost important GA parameters are the cross-over and the mutation rates.They form an upper bound on the search space. These were obtainedthrough an exhaustive trial and error process. The GA performance canbe altered using their parameters, particularly the GA run length and popu-lation size. However, it would require an adequate number of iterations toachieve the best combination of parameters that can lead to the desiredoutput.Data Element ListThe data elements were determined after a thorough analysis of thedesign aspects and requirements. The data types for the various data ele-ments were identified based on the nature of the variables and theirexpected values. The nature of the data elements is important from theprogramming standpoint as it decides the variables to be used and theirdata types. A summary listing of the data elements is shown in Table 3.There was only one gear data set available in the literature that couldprovide the necessary results to validate this study. A data set of gear para-meters was obtained from Tavakoli (1983) for development of the GA. Dueto the lack of data that could be corroborated further with comparativeresults, the entire research was carried out based on Tavakolis gear data.All the results and verification and validation were based on this set of geardata.Screen Hierarchy of GA-Based Computer ModelHierarchy of screens is a logical-flow=structure of screens that shows theinteractions between the different systems modules.The GA computer-based systems first screen is the main screen, whichprovides information regarding the GA model. Next is the input screen forMinimize Error of Gear Sets167gear design parameters of the pair of mating gears. The GA selectionscreen, where the GA parameters are selected, follows in the hierarchy.After the GA analysis, the results screen displays the generated outcomesin terms of the magnitude of the profile errors for the gear pair, as wellas in terms of the objective function value.Inputs ScreenThe inputs screen (Figure 5) is used for collecting the design data forthe mating gear set. It inquires for specific gear parameters through corre-sponding textboxes for both pinions and gears. Once all the fields arefilled, the next button can be pressed to move forward in the analysis.Selection of Genetic Algorithm Parameters ScreenThis screen is used to input various GA-related parameters (Figure 6).The selected parameter combination directs the search mechanism. TheGA parameters can be changed by using appropriate prompt boxes: num-ber of GA runs (i.e., the number of generation before GA terminates),population size, crossover rate, mutation rate, tournament selection size,and the maximum and minimum value allowed for the profile errors.TABLE 3Data Element ListDataData TypeSourceTooth ThicknessNumericKeyboardModuleNumericKeyboardContact RatioNumericKeyboardFace WidthNumericKeyboardPressure AngleNumericKeyboardInput TorqueNumericKeyboardFillet RadiusNumericKeyboardOutside Diameter of the PinionNumericKeyboardOutside Diameter of the GearNumericKeyboardRoot Diameter of the PinionNumericKeyboardRoot Diameter of the GearNumericKeyboardPitch Circle Diameter of the PinionNumericKeyboardPitch Circle Diameter of the GearNumericKeyboardNumber of Teeth of PinionNumericKeyboardNumber of Teeth of GearNumericKeyboardNumber of GA runsNumericKeyboardPopulation SizeNumericKeyboardCross Over RateNumericKeyboardChromosome SizeNumericKeyboardMutation RateNumericKeyboardTournament SelectionNumericKeyboardMax Profile ErrorNumericKeyboardMin Profile ErrorNumericKeyboardProfile Modifications Along the Range of ContactNumericSystem CalculatedObjective Value of the GANumericSystem Calculated168D. J. Fonseca et al.The default values are first displayed on the prompt boxes, and the user isadvised to use them, as they are efficient in most of the cases. The user canvary them as necessary, so as to accommodate any solution that lies abovethe upper default limit. The GA progress information (generation num-ber) is displayed on the form caption area for each generation.Results ScreenAfter the GA completes its analysis, the selection of genetic algorithmparameters screen is unloaded while the results screen is loaded(Figure 7). It includes the objective value of the best solution so far foundby the GA, and the magnitudes of the profile errors along the four pointson the range of contact for each gear recommended by the GA. The exitbutton allows the user to end the ongoing session.Fast Fourier Transformation (FFT) ModuleIn order to obtain the amplitude of mesh harmonic frequency forthe objective function, a Fast Fourier Transformation (FFT) module isFIGURE 5 Inputs screen.Minimize Error of Gear Sets169FIGURE 7 Results screen.FIGURE 6 Selection of genetic algorithm parameters screen.170D. J. Fonseca et al.incorporated into the system. The module carries out the discrete FFT ofthe transmission error for the gear pair during its mesh cycle.The discrete FFT is an algorithm which converts a sampled complex-valued function of time into a sample complex-valued function of fre-quency. This algorithm is the most widely used algorithm for this type oftransformation. The VB code for this algorithm was taken from Cross(1999) with minor modifications.The GA sends the transmission error for the jth calculation point of theFFT module, which in turn carries out the required transformation. Thismodule returns a final calculated value for real and imaginary terms ofthe complex output, which is used to find the amplitude of each mesh har-monic frequency. The code requires the number of inputs to be a positiveinteger of the 2nd power. Through this program, 256 inputs go into theFFT module for processing.Genetic Algorithm Model DesignGenetic algorithms are search algorithms based on the mechanics ofnatural selection and natural genetics. In GAs, the optimization processstarts with the coding of the input parameters as a finite-length string.There are many distinct ways to code the parameters, e.g., in terms ofbinary digits or as floating point values.Coding SchemeThe transmission error problem at hand is focused on two factors,namely the determination of the Fourier spectrum of transmission error,and its optimization using the profile modifications. Thus, the codingscheme for this problem covers the profile modifications while the objec-tive function covers the sum of the amplitudes of the first five harmonicsof the Fourier spectrum.The coding scheme for this problem is a set of floating point numbers,which represents profile modifications in mm. Z1 to Z4 are the profilemodifications on the tooth of the pinion at specified contact points alongthe range of contact, and Z5 to Z8 are the profile modifications on thetooth of the gear at those respective contact points. Thus, as shown inFigure 8, the string length of each chromosome is 8. During the generationof the first population, each bit position is randomly generated based onFIGURE 8 Sample chromosome for the GA model.Minimize Error of Gear Sets171the lower and upper bounds set on the profile modifications. The user canmodify the upper and lower bounds on the profile modifications based onexperience, gear design standards, and manufacturing capabilities.Fitness Function DesignOne of the most challenging parts of designing a GA model is the devel-opment of a fitness function from the problems objective function. A fit-ness function could be a mathematical expression or a piece of codethat, when evaluated, represents the strength of a solution set or chromo-some.In this study, the function given in Eq. (28) must be minimized. To doso, a series of calculations had to be carried out for each chromosome,using the procedure discussed earlier.Once the models inputs are provided by the user, the program calcu-lates the ideal involute profile for the tooth using the equations given ear-lier. The user then navigates to the next screen selecting the range of theprofile modifications for the pinion and the gear under scrutiny. Subse-quently, the program calculates the profile modifications along the toothprofile using the linear curve-fit using Eq. (10). It also calculates the totalmesh compliance for the gear pair by utilizing the relationships developedfrom Eqs. (11) through (24). The total transmission error is thus calculatedby solving the load sharing equations as given in Eqs. (25) through (27).The total transmission error is then fed into the FFT module of the pro-gram, which processes it, and gives the amplitudes of the mesh harmonicsas output.After creating the Fourier spectrum of the transmission error for therange of contact, the sum of amplitudes for the five harmonics is con-sidered as the fitness function to be minimized. The weights for the individ-ual amplitudes are decided through a trial and error process.Selection of Mating ParentsThe selection of these two most eligible solutions is critical in GAtheory. Selection of two parents for mating is done using two methods,namely roulette-wheel selection and tournament selection. Because ofthe strength of the tournament selection method to prevent stochasticerrors, it was used in this study. In the tournament selection, a pool of ran-domly chosen solutions based upon their objective values is created. Thesesolutions are then compared with each other, with respect to their objectivevalues, and the best solution among the pool is selected for mating. Thelarger the pool size, the greater the chances of selecting better parentchoices for mating.A pool size of four was chosen to be appropriate for the selectionprocess in the present study. The GA model at random selects four172D. J. Fonseca et al.chromosomes from the population and keeps them in a mating pool as illu-strated in Figure 9. The best chromosome based on its highest fitness (i.e.,lowest transmission error) is thus selected from this pool as a new memberof the next generation. In the following example, since chromosome 1 hasthe lowest transmission error, it is selected for mating.Crossover and MutationAs the chromosome length for this research is just eight, a single pointcrossover was selected. First, it is randomly decided whether or not cross-over will be performed. This decision is entirely based on the probabilityof crossover or the crossover rate. If yes, a point is then selected at randomwith a size smaller than the maximum chromosome size. Such a location iscalled the point of crossover, which divides the chromosome into two parts.Thus, the flip-flopping of the cut parts of the two chromosomes is carriedout to create two new offspring, as shown in the Figure 10. A crossoverprobability of 0.9 was found to be a good compromise between good onlineand offline performance as the stochastic errors of samplings are reduced.A normal mutation operator carries out the mutation with a probabilityof 0.1. It suggests that out of every ten bit positions, one would be mutated.At each bit position, a biased coin is flipped to decide if mutation shouldoccur. If yes, then a random value is generated between the lower andupper limits of the profile modifications to replace that bit position (Figure10). In the above example, on the first chromosome, the fourth bit positionis selected for mutation, and hence, replaced by a random value of 0.024.GA Termination ConditionThe GA terminating conditions depend upon the number of GA runs.The GA would execute for the set number of runs, even though the opti-mal=near optimal solution may have already been reached. A GA run ofFIGURE 9 Mating pool.Minimize Error of Gear Sets173500 generations was found adequate to obtain near optimal solution forthis specific problem. The user can run the GA model for as many as32,000 generations if needed.MODEL VALIDATIONSeveral small TE optimization problems that could be easily opti-mized through the mathematical formulation were generated and fed intothe GA model, which provided the optimal solution for all the cases. Then,Tavakolis (1983) cited test care, which has been adopted as a baseline byseveral researchers since it is one of the very few representative problemsof considerable complexity with a known optimum solution, was used tovalidate the system.FIGURE 10 Crossover and mutation.174D. J. Fonseca et al.The test case involved two steps. First, the GA model was used to gener-ate the systems TE with no profile modifications. This is always done toprovide a baseline for the error minimization once the profiles modifica-tions are introduced. Such a TE value was compared against that reportedby Tavakoli (1983) to asses the performance of the model when profilemodifications are absent. Table 4 depicts the inputs fed into the model,as well as the outputs generated during this validation phase. The GAmodel provided total mesh compliance values within 10% of those foundby in Tavakoli (1983). To obtain TE values within the 10% vicinity of theideal reported optimal value shows an outstanding performance of themodel. A hypothetically perfect gear mesh, for which there are no manu-facturing errors and no tooth deflections, would have a zero transmissionerror. Neverthless, no matter how error-free the manufacturing of the gearsmight be, the deflections of the teeth cause the transmission error to benonzero (Houser et al., 1984).Once the baseline calculations were validated against the results given inthe literature, GA runs were carried out to optimize on the profile modifica-tions so to minimize the transmission error. Table 5 gives the details of thetest case data involved in the GA optimization of the profile modifications.TABLE 4Predictive Validation Case without Profile ErrorSpecificationsValuesInputsNo. of Teeth on Pinion34No. of Teeth on Gear35Outside Diameter of Pinion (mm)155.44Outside Diameter of Gear (mm)159.0Face Width (mm)28.45Contact Ratio1.68Module0.24Tooth Thickness (mm)7.37Root Diameter of Pinion (mm)134.62Root Diameter of Gear (mm)138.68Pitch Diameter of Pinion (mm)145.95Pitch Diameter of Gear (mm)154.24Input Torque (Nm)791Pressure Angle20Chromosome Size8Mutation Rate0.2Tournament Selection4Max Value of Profile Error (mm)?0.01Min Value of profile Error (mm)?0.001OutputsSum of Amplitudes (Microns)19.4Profile Modification at Root (Pinion, Gear)0Profile Modification at Low Point (Pinion, Gear)0Profile Modification at High Point (Pinion, Gear)0Profile Modification at Tip (Pinion, Gear)0Minimize Error of Gear Sets175A comparision of the baseline and the optimized results for trans-mission error is shown in Figure 11 and Figure 12. Figure 11 shows thetransmission error for the ideal case with no errors and the optimized casewith profile errors for one mesh cycle,. The Fourier spectrum of the trans-mission error for both cases is shown in Figure 12.The transmission error for the one mesh cycle with optimized profilemodifications shows a similar trend along the idealized case. As it is clearin Figure 11 that the two line graphs intersect at the pitch point whereno profile modification occurs. The Fourier spectrum for the optimizedprofile modifications is very similar to the ideal case, suggesting the conver-gence of the GA to obtain baseline results.After analyzing the results from the predictive validation
温馨提示:
1: 本站所有资源如无特殊说明,都需要本地电脑安装OFFICE2007和PDF阅读器。图纸软件为CAD,CAXA,PROE,UG,SolidWorks等.压缩文件请下载最新的WinRAR软件解压。
2: 本站的文档不包含任何第三方提供的附件图纸等,如果需要附件,请联系上传者。文件的所有权益归上传用户所有。
3.本站RAR压缩包中若带图纸,网页内容里面会有图纸预览,若没有图纸预览就没有图纸。
4. 未经权益所有人同意不得将文件中的内容挪作商业或盈利用途。
5. 人人文库网仅提供信息存储空间,仅对用户上传内容的表现方式做保护处理,对用户上传分享的文档内容本身不做任何修改或编辑,并不能对任何下载内容负责。
6. 下载文件中如有侵权或不适当内容,请与我们联系,我们立即纠正。
7. 本站不保证下载资源的准确性、安全性和完整性, 同时也不承担用户因使用这些下载资源对自己和他人造成任何形式的伤害或损失。
提示  人人文库网所有资源均是用户自行上传分享,仅供网友学习交流,未经上传用户书面授权,请勿作他用。
关于本文
本文标题:远舰汽车变速器设计【两轴式五档手动】【7张CAD图纸】【汽车车辆专业】
链接地址:https://www.renrendoc.com/p-402787.html

官方联系方式

2:不支持迅雷下载,请使用浏览器下载   
3:不支持QQ浏览器下载,请用其他浏览器   
4:下载后的文档和图纸-无水印   
5:文档经过压缩,下载后原文更清晰   
关于我们 - 网站声明 - 网站地图 - 资源地图 - 友情链接 - 网站客服 - 联系我们

网站客服QQ:2881952447     

copyright@ 2020-2025  renrendoc.com 人人文库版权所有   联系电话:400-852-1180

备案号:蜀ICP备2022000484号-2       经营许可证: 川B2-20220663       公网安备川公网安备: 51019002004831号

本站为文档C2C交易模式,即用户上传的文档直接被用户下载,本站只是中间服务平台,本站所有文档下载所得的收益归上传人(含作者)所有。人人文库网仅提供信息存储空间,仅对用户上传内容的表现方式做保护处理,对上载内容本身不做任何修改或编辑。若文档所含内容侵犯了您的版权或隐私,请立即通知人人文库网,我们立即给予删除!